Is the Retrace Higher Over for USD/JPY?
USD/JPY retraced higher earlier today, but the 50 SMA stopped the pullback on the H1 chart
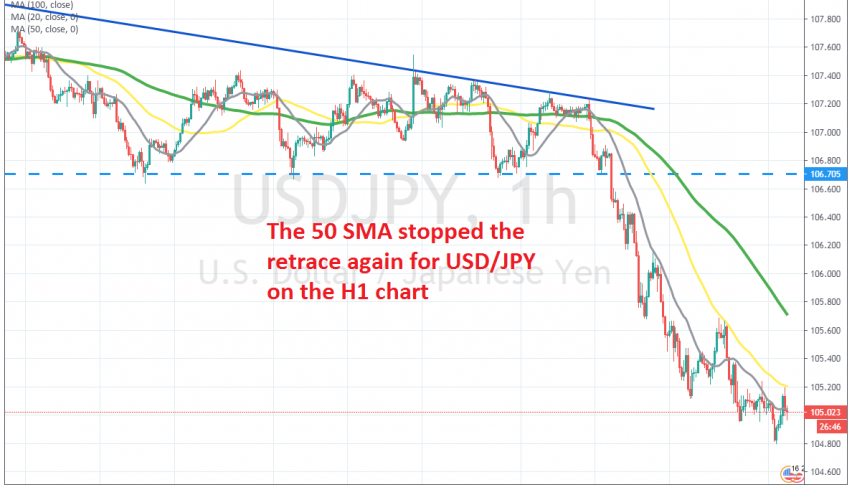
[[USD/JPY]] was trading within a range between 106.80s and 107.80s since the middle of June until last week, when the sentiment surrounding the USD turned massively negative and this forex pair broke below the support level 107.80 finally.
The decline was quite fast, as higher period moving averages weren’t able to catch up with the price, even on the H1 chart. The 20 SMA (grey) eventually caught up and it provided resistance during the first pullback. It stopped the retrace and reversed the price back down.
We saw another pullback eventually yesterday, but the 50 SMA (yellow) took its turn in providing resistance this time. Today we saw another retrace higher on the H1 chart, but the 50 SMA stopped the climb once again and now the price is turning lower. We missed the chance to open a sell forex signal at the 50 SMA, but are following the price action, to see if another retrace takes place.
- Check out our free forex signals
- Follow the top economic events on FX Leaders economic calendar
- Trade better, discover more Forex Trading Strategies
- Open a FREE Trading Account
Related Articles


Comments
Sidebar rates
Related Posts
