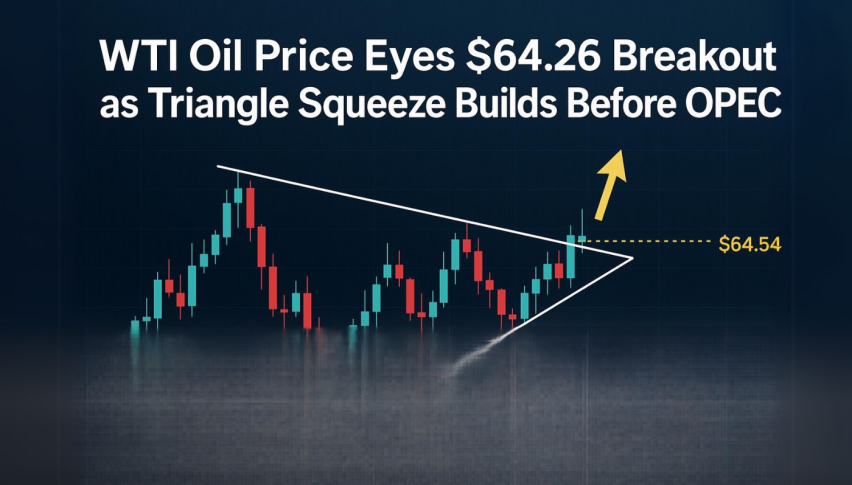
WTI Oil Price Eyes $64.26 Breakout as Triangle Squeeze Builds Before OPEC+
Oil prices edged up slightly on Monday as traders waited for OPEC+ decisions and a murky US-China trade backdrop. WTI Crude (WTI/USD)...
Quick overview
- Oil prices rose slightly as traders await OPEC+ decisions amidst US-China trade uncertainties.
- Traders are defensively positioned ahead of the May 5 OPEC+ meeting, with concerns over production hikes and global growth.
- Geopolitical risks, including Iran's nuclear talks and recent incidents in the Middle East, are adding volatility to the market.
- WTI Crude is currently in a symmetrical triangle pattern, with key breakout and support levels identified.
Oil prices edged up slightly on Monday as traders waited for OPEC+ decisions and a murky US-China trade backdrop. WTI Crude (WTI/USD) traded around $63.28 for a third day after last week’s 1% drop.
Michael McCarthy, CEO of Moomoo Australia, said “there’s no new news” and traders are defensively positioned ahead of OPEC+ meeting on May 5. Expectations of production hike and global growth concerns due to trade tensions are weighing on sentiment.
Washington and Beijing are sending conflicting signals. US Treasury Secretary Scott Bentsen dampened hopes of new trade talks, while President Trump earlier made positive comments. Beijing flatly denied any ongoing talks.
Traders are watching:
OPEC+ production adjustments
Iran-US nuclear talks in Oman
Geopolitical risks from Middle East events
OPEC+ and Global Trade Jitters
While traders wait for supply decisions, broader geopolitical trends are adding volatility. Investors are following nuclear talks between Iran and US, with Iranian Foreign Minister Abbas Araqchi saying there’s limited optimism.
Separately, an explosion at Iran’s Bandar Abbas port – the country’s largest – killed at least 40 and injured over 1,200, raising concerns about infrastructure stability in an oil producing nation.
Meanwhile, US-Ukraine talks are showing diplomatic progress, but markets are focused on trade disputes as the bigger economic risk.
Key factors affecting oil sentiment:
Iran’s nuclear talks uncertainty
Middle East supply disruption risks
Cautious optimism for a Russia-Ukraine deal
IMF/World Bank Spring Meeting signals on global demand
WTI Crude Oil Chart: Breakout or Breakdown?
On the chart, WTI Crude is compressing into a symmetrical triangle on the 1-hour chart. The price is above the 50-hour EMA ($62.88) and between support at $62.27 and resistance at $63.67.For newbies, this is a triangle squeeze. A clean breakout above $63.67 could take prices to $64.26 and $64.84. Below $62.27 and it’s downside to $61.81.
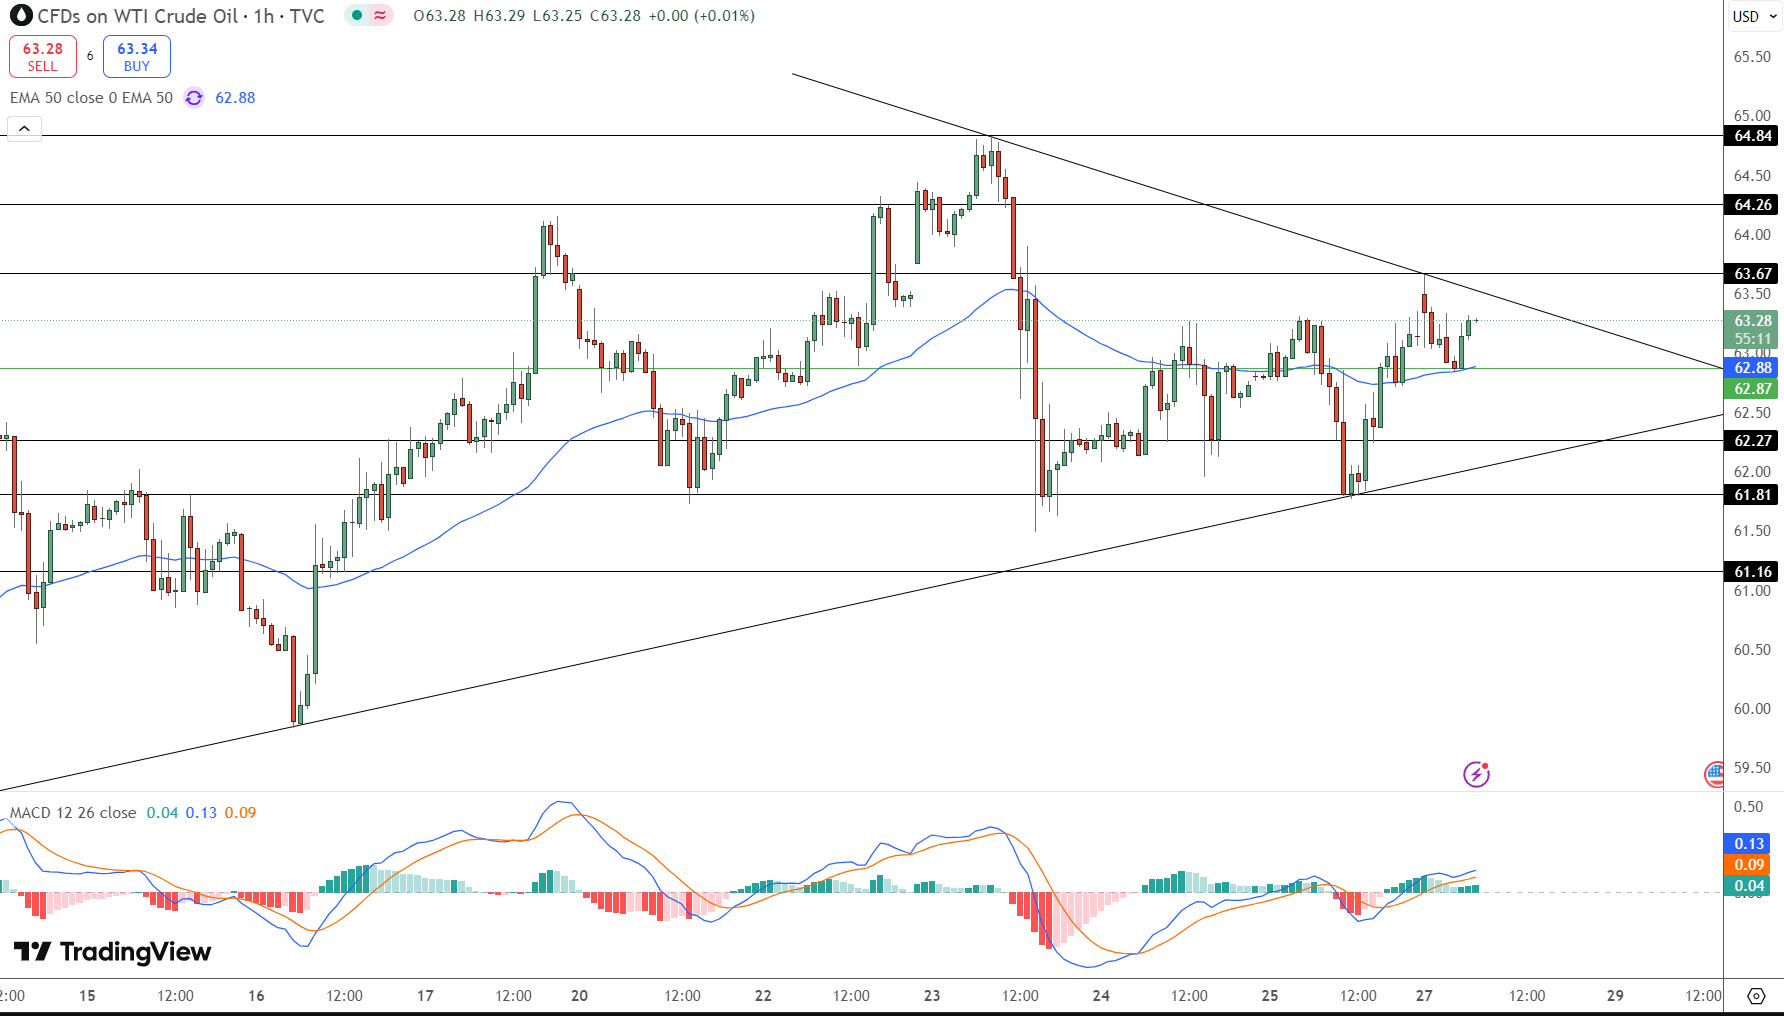
Trade Setup:
Buy Breakout: Above $63.67
Targets: $64.26 and $64.84
Support to Watch: $62.27
Stop-Loss: Below $61.81
Be patient. Wait for a clean breakout before entering, as whipsaws are common when patterns compress at apex.
- Check out our free forex signals
- Follow the top economic events on FX Leaders economic calendar
- Trade better, discover more Forex Trading Strategies
- Open a FREE Trading Account
Related Articles

Comments
Sidebar rates
Related Posts
