USOIL Breakout? WTI Crude Oil Eyes $64.80 Resistance
WTI crude oil (USOIL) is holding at $63.27 on Friday, up for the second day as geopolitical stress eases.
Quick overview
- WTI crude oil is currently at $63.27, experiencing a modest increase due to easing geopolitical tensions.
- Ongoing trade talks between the U.S. and China may lead to tariff exemptions on certain U.S. goods, improving market sentiment.
- Despite the recent bounce, WTI is expected to close the week lower due to global oversupply and declining demand.
- Technical indicators suggest a potential bullish breakout above $64.80, with targets set at $65.97 and $67.64.
WTI crude oil (USOIL) is holding at $63.27 on Friday, up for the second day as geopolitical stress eases. President Trump said trade talks with China are ongoing,
countering Beijing’s claim that no talks were happening. In response, China is reportedly making a list of US goods eligible for tariff exemptions—so maybe the 125% retaliatory duties won’t be so bad after all.
That’s helped sentiment, says LSEG’s Anh Pham: “Oil is up modestly as markets react to a change in Fed tone and tariff headlines.” But the bigger picture is mixed. Despite the bounce, WTI will still close the week lower due to global oversupply and softening demand.
Supply Worries and Sanctions in Focus
Behind the scenes, the bigger picture is still capping gains. OPEC+ members are talking about increasing production in June—just as global inventories are already high. And the lifting of sanctions on Russian and Iranian oil could bring millions of barrels back to the market.
OPEC+ Expansion Talk: Members are hinting at increasing output again.
Iran Deal Hopes: Foreign Minister Araqchi is ready for European talks.
Russia Tensions Easing: FM Lavrov says Ukraine progress via CBS.
If the diplomacy works, get ready for a supply surge that could offset near-term bullish catalysts.
Technical Setup: Watch $64.80 Break
On the charts, WTI has a clear ascending trendline from the April 8 low. Price is consolidating above the 50-period EMA ($62.80) with the MACD histogram turning positive—an early sign of strength.
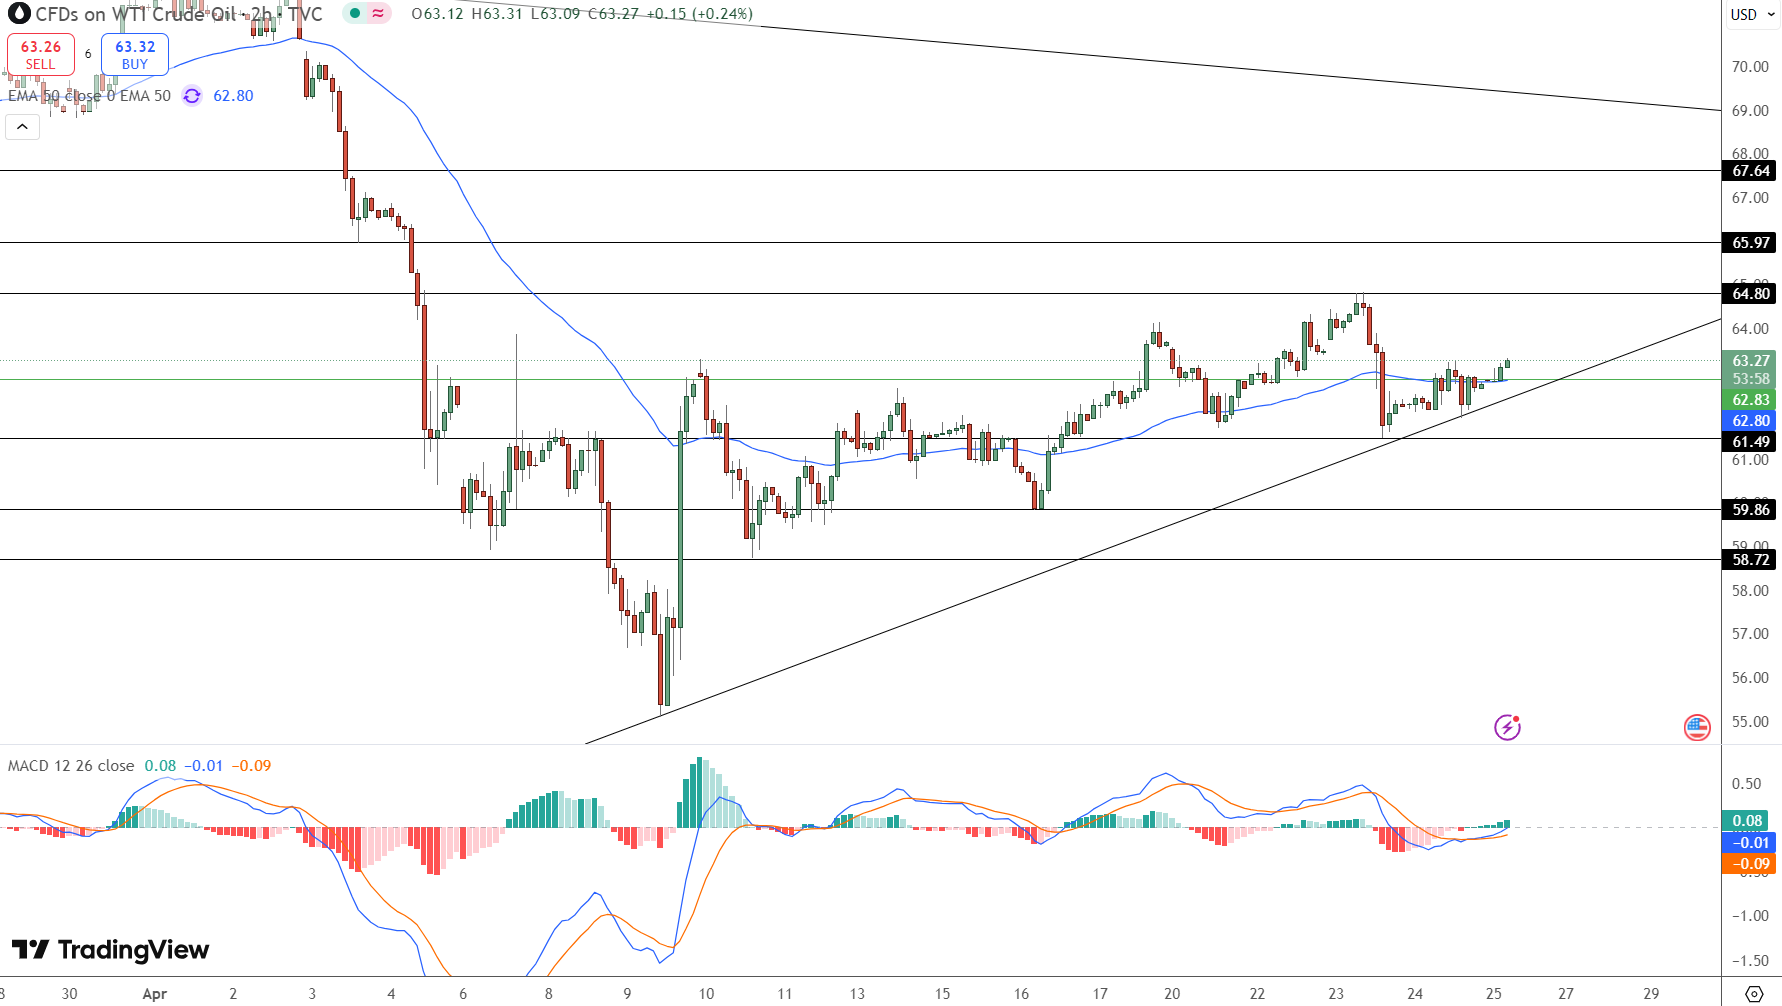
For new traders, this is a textbook “trendline continuation” trade. A break above $64.80 and confirmation could see $65.97 and $67.64. But failure to hold $62.80 could see crude slide back to $61.49.
Trade Setup:
Buy Entry: Break above $64.80 and confirm
Targets: $65.97 and $67.64
Stop Loss: Below $62.80
Key Takeaway:
Oil is up but macro risks—OPEC+ supply and geopolitical negotiations—looming. Let price confirm before going long.
- Check out our free forex signals
- Follow the top economic events on FX Leaders economic calendar
- Trade better, discover more Forex Trading Strategies
- Open a FREE Trading Account
Related Articles
Comments
Sidebar rates
Related Posts
