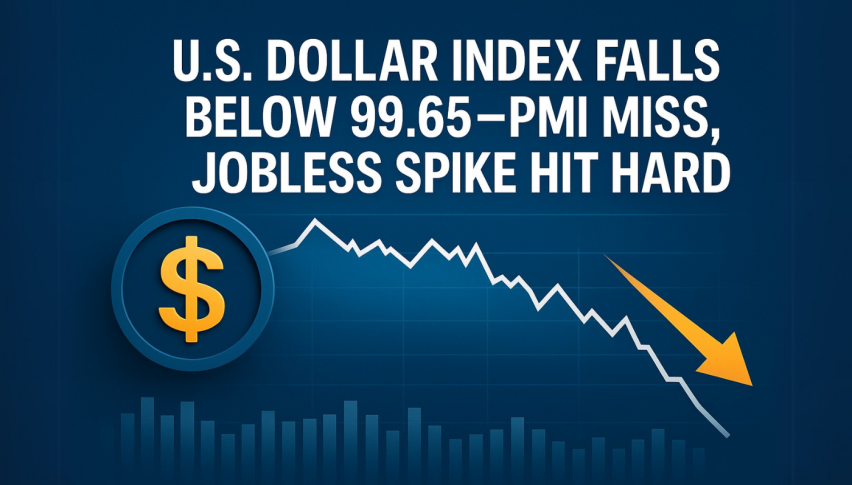
U.S. Dollar Index Falls Below 99.65—PMI Miss, Jobless Spike Hit Hard`
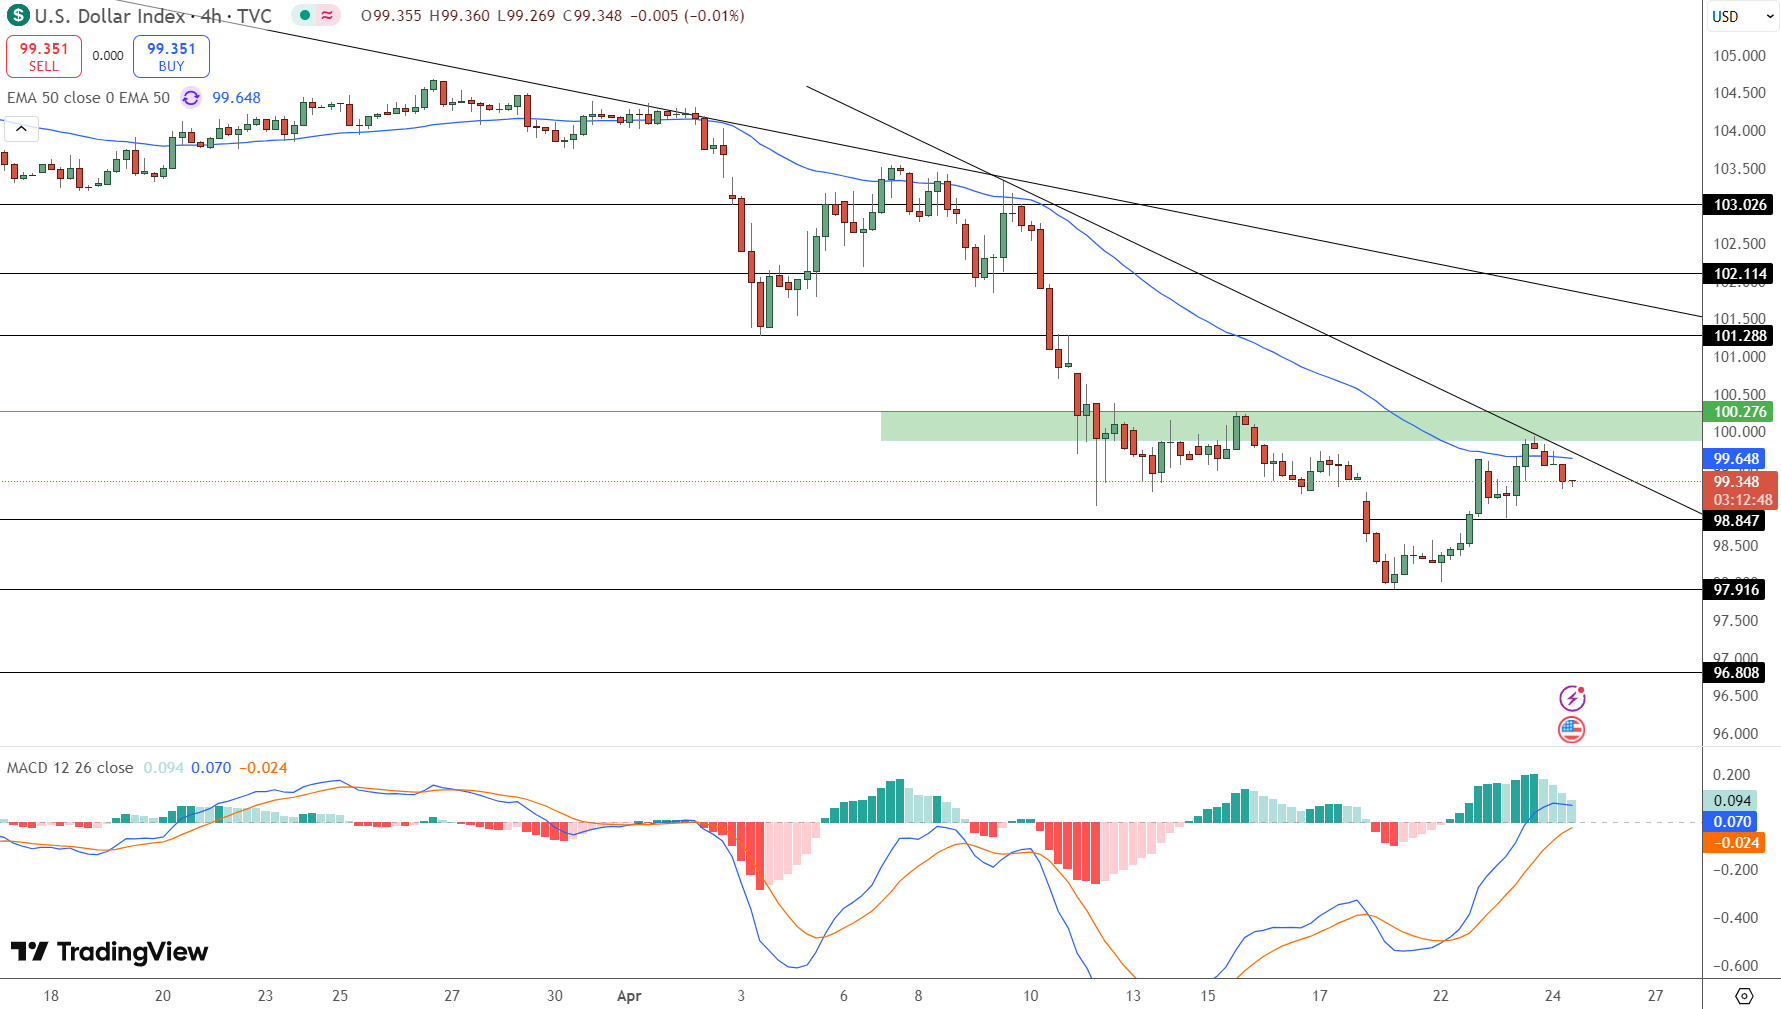
DXY dipped to $99.34 on Thursday after failing to break through $99.65. That resistance zone (50 EMA and descending trendline) remains...
Quick overview
- DXY fell to $99.34 after failing to break resistance at $99.65, influenced by weak economic data and geopolitical concerns.
- Initial jobless claims rose to 222,000, indicating a cooling labor market, while April's S&P Global Composite PMI dropped to its lowest since December 2023.
- Investor sentiment is affected by renewed trade tensions, with the White House preparing a new tariff package on China, raising concerns about inflation and employment.
- Technically, a break below the support level of $98.84 could lead DXY to lower targets of $97.91 or $96.80, while caution is advised in trading.
DXY dipped to $99.34 on Thursday after failing to break through $99.65. That resistance zone (50 EMA and descending trendline) remains in play for now.
What was behind the move? Underwhelming economic data and geopolitical jitters. Initial jobless claims rose to 222,000 vs 215,000 expected and labor market is cooling. April’s S&P Global Composite PMI fell to 51.2, its weakest since December 2023. Manufacturing PMI was a modest surprise at 50.7 but services PMI disappointed at 51.4 vs 54.4. Together, the numbers point to slowing growth and fading post-pandemic momentum.
Trump’s Tariff Rhetoric Clouds the Outlook
Beyond economic data, investor sentiment is also being influenced by renewed trade tensions. The White House is preparing a new tariff package on China and markets are getting nervous. Treasury Secretary Scott Bessent said any meaningful de-escalation would require mutual cooperation—something markets don’t believe.
Adding to the caution, Fed Chair Jerome Powell warned this week that rising tariffs could put inflation and employment goals at risk but the Fed is still in “wait-and-see” mode on rate moves.
Technical Outlook: $98.84 Is the Line in the Sand
From a charting perspective, DXY’s failure to break $99.65-$100.27 has shifted focus back to support at $98.84. This is a big zone. A clean break below it could send DXY to $97.91 or even $96.80 if risk appetite increases and macro headwinds persist.
Trade Setup for New Traders:
Sell Entry: Below $98.84 with confirmation (e.g. strong red candle or MACD crossover)
Targets: $97.91 and $96.80
Stop Loss: Above $99.65 to manage risk
Current Technicals:
50 EMA: Above current price, acting as dynamic resistance
MACD Histogram: Flattening—momentum is fading
Pivot Zone: $98.84 – Watch for daily close below this levelA daily close below $98.84 would confirm the trade. Above $100.27 and the setup is invalid and $101.28 and $102.11 would be in play.
Conclusion
With softer data, rising jobless claims and tariff threats, the dollar is losing its way—for now. But this isn’t a free fall. It’s a cautious correction in a high risk macro environment. Trade patiently and wait for confirmation not prediction. Volatility is back and this market favors confirmation over prediction.
- Check out our free forex signals
- Follow the top economic events on FX Leaders economic calendar
- Trade better, discover more Forex Trading Strategies
- Open a FREE Trading Account
Related Articles

Comments
Sidebar rates
Related Posts
