WTI Crude Jumps 3.5% to $64.68 Amid Iran Sanctions and OPEC+ Cuts
WTI crude futures rose 3.5% on Thursday to close at $64.68, up for a second day. The move was driven by new US sanctions on Iranian oil...
Quick overview
- WTI crude futures increased by 3.5% to close at $64.68, driven by new US sanctions on Iranian oil exports.
- OPEC+ members proposed production cuts that could remove up to 520,000 b/d from the market, contributing to a supply squeeze.
- Goldman Sachs has lowered its oil price forecast due to oversupply and demand slowdown, expecting WTI to average $59 in 2025.
- Technical indicators suggest a bullish outlook for WTI, with a key resistance level at $65.67 that traders are closely monitoring.
WTI crude futures rose 3.5% on Thursday to close at $64.68, up for a second day.
The move was driven by new US sanctions on Iranian oil exports, including those on Chinese importers and shipping networks tied to sanctioned crude flows. The Biden administration says the goal is to cut Iran’s oil revenues and pressure its nuclear program.
Meanwhile, OPEC+ members – including Iraq and Kazakhstan – submitted new production cut plans to offset prior overages. These cuts could remove up to 520,000 b/d from the market, adding to the supply squeeze.
Market Outlook: Bullish Now, But Demand Risks Linger
Supply is driving prices higher in the short term, but demand risks still loom.
Goldman Sachs just cut its oil price forecast, citing:
Oversupply from non-compliant OPEC+ producers
Demand slowdown due to global trade tensions
Recession in major economies like the US and China
The bank now expects WTI to average $59 in 2025, and $55 in 2026.
But geopolitics is trumping macro fears for now, so traders are on high alert for more upside.
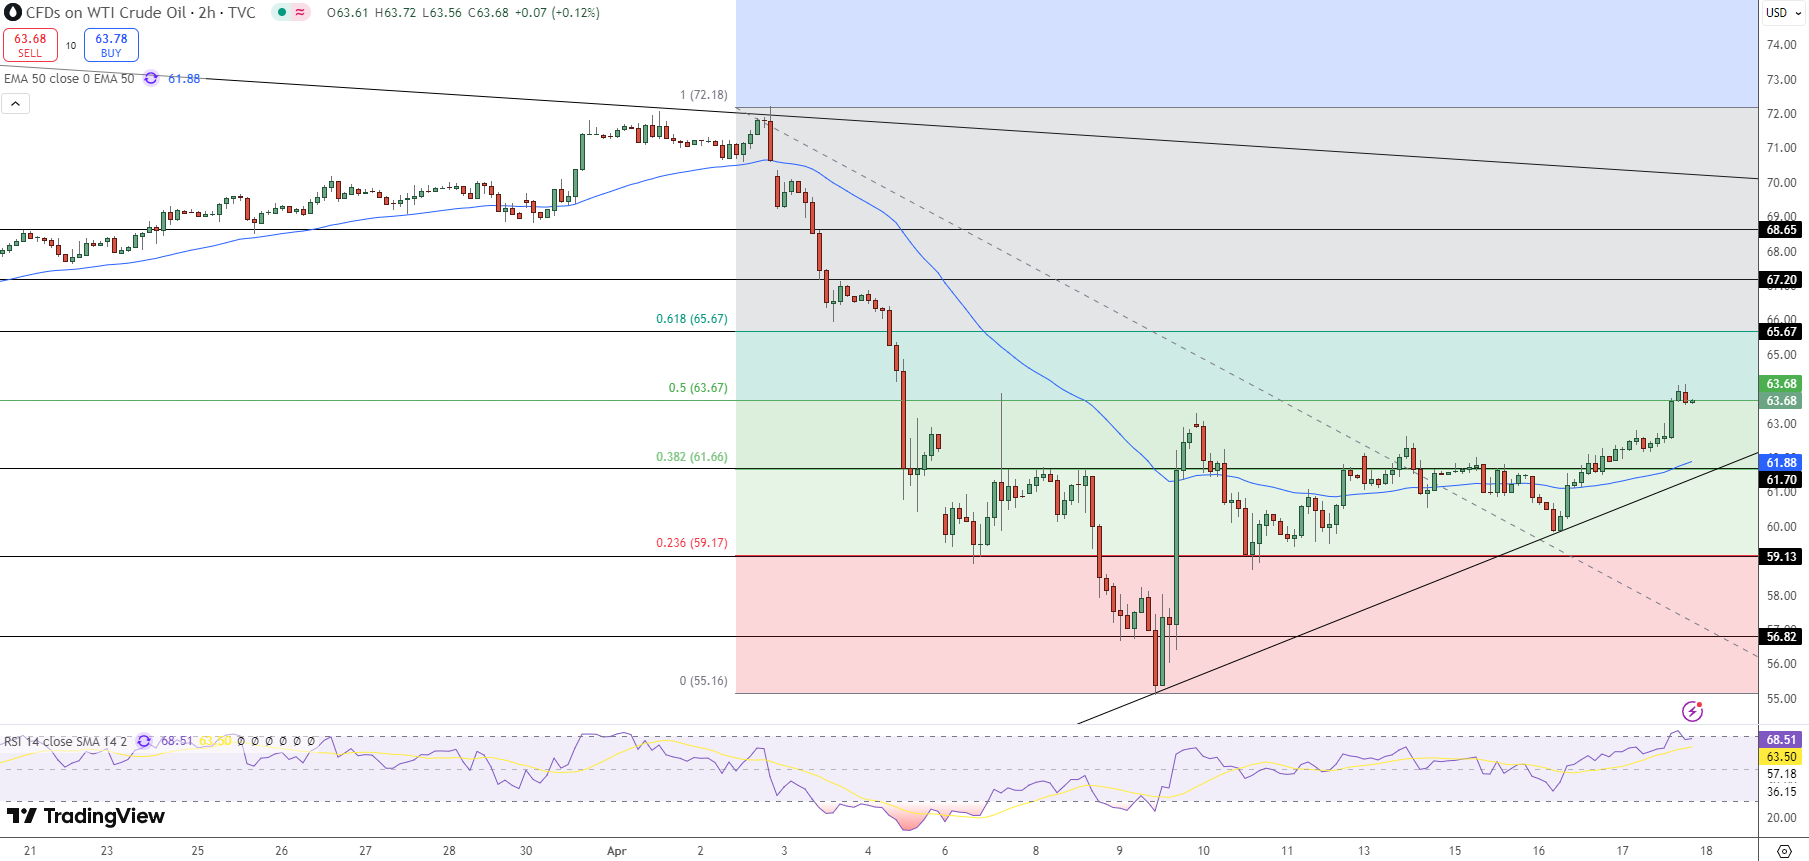
Technical Analysis: All Eyes on $65.67 Resistance
On the chart, WTI is looking bullish:
Price reclaimed the 50-period EMA at $61.88
Cleared the 50% Fibonacci at $63.67
Approaching the $65.67 resistance – 61.8% Fib and historical supply zone
The RSI is at 67, not yet overbought.
Trade Setup
If you’re new to crude oil trading, this is a strategic opportunity – but be patient.
Entry: Buy on pullback to $63.00-$63.20
Target: $65.67 (Fibonacci resistance)
Stop Loss: Below $61.70 (EMA + trendline confluence)
Pro Tip: Watch for a full candle close above $64.00 with rising volume. Don’t chase if RSI crosses 70 – that could be exhaustion.
Bottom Line
WTI is riding supply tightness, geopolitics and technicals. But the rally isn’t risk free – weaker demand in China and US could cap at $66-$67.
For now, momentum is with the bulls. If they can get above $65.67, next stop could be $67.20 – if demand holds.
- Check out our free forex signals
- Follow the top economic events on FX Leaders economic calendar
- Trade better, discover more Forex Trading Strategies
- Open a FREE Trading Account
Related Articles
Comments
Sidebar rates
Related Posts
