Apple (APPL) Stock Recovers Quickly After Reaching Critical Support

Quick overview
- Apple Inc. (AAPL) has experienced a 35% retracement, entering a critical support zone between $164 and $171.
- The stock has rebounded approximately 26% recently, breaking above the 0.382 Fibonacci resistance level at $204.
- Technical indicators present a mixed outlook, with bullish momentum suggested by the MACD histogram but bearish pressure indicated by the death cross in EMAs.
- AAPL's future direction remains uncertain, with potential resistance at the golden ratio near $228 and a risk of retesting key support levels.
Over the past five months, Apple Inc. (AAPL) has undergone a significant 35% retracement, bringing the stock into a critical support zone. Price action now suggests a potential bullish rebound as AAPL attempts to reclaim its prior uptrend. The question remains: is this the beginning of a sustained recovery or just a temporary relief rally?
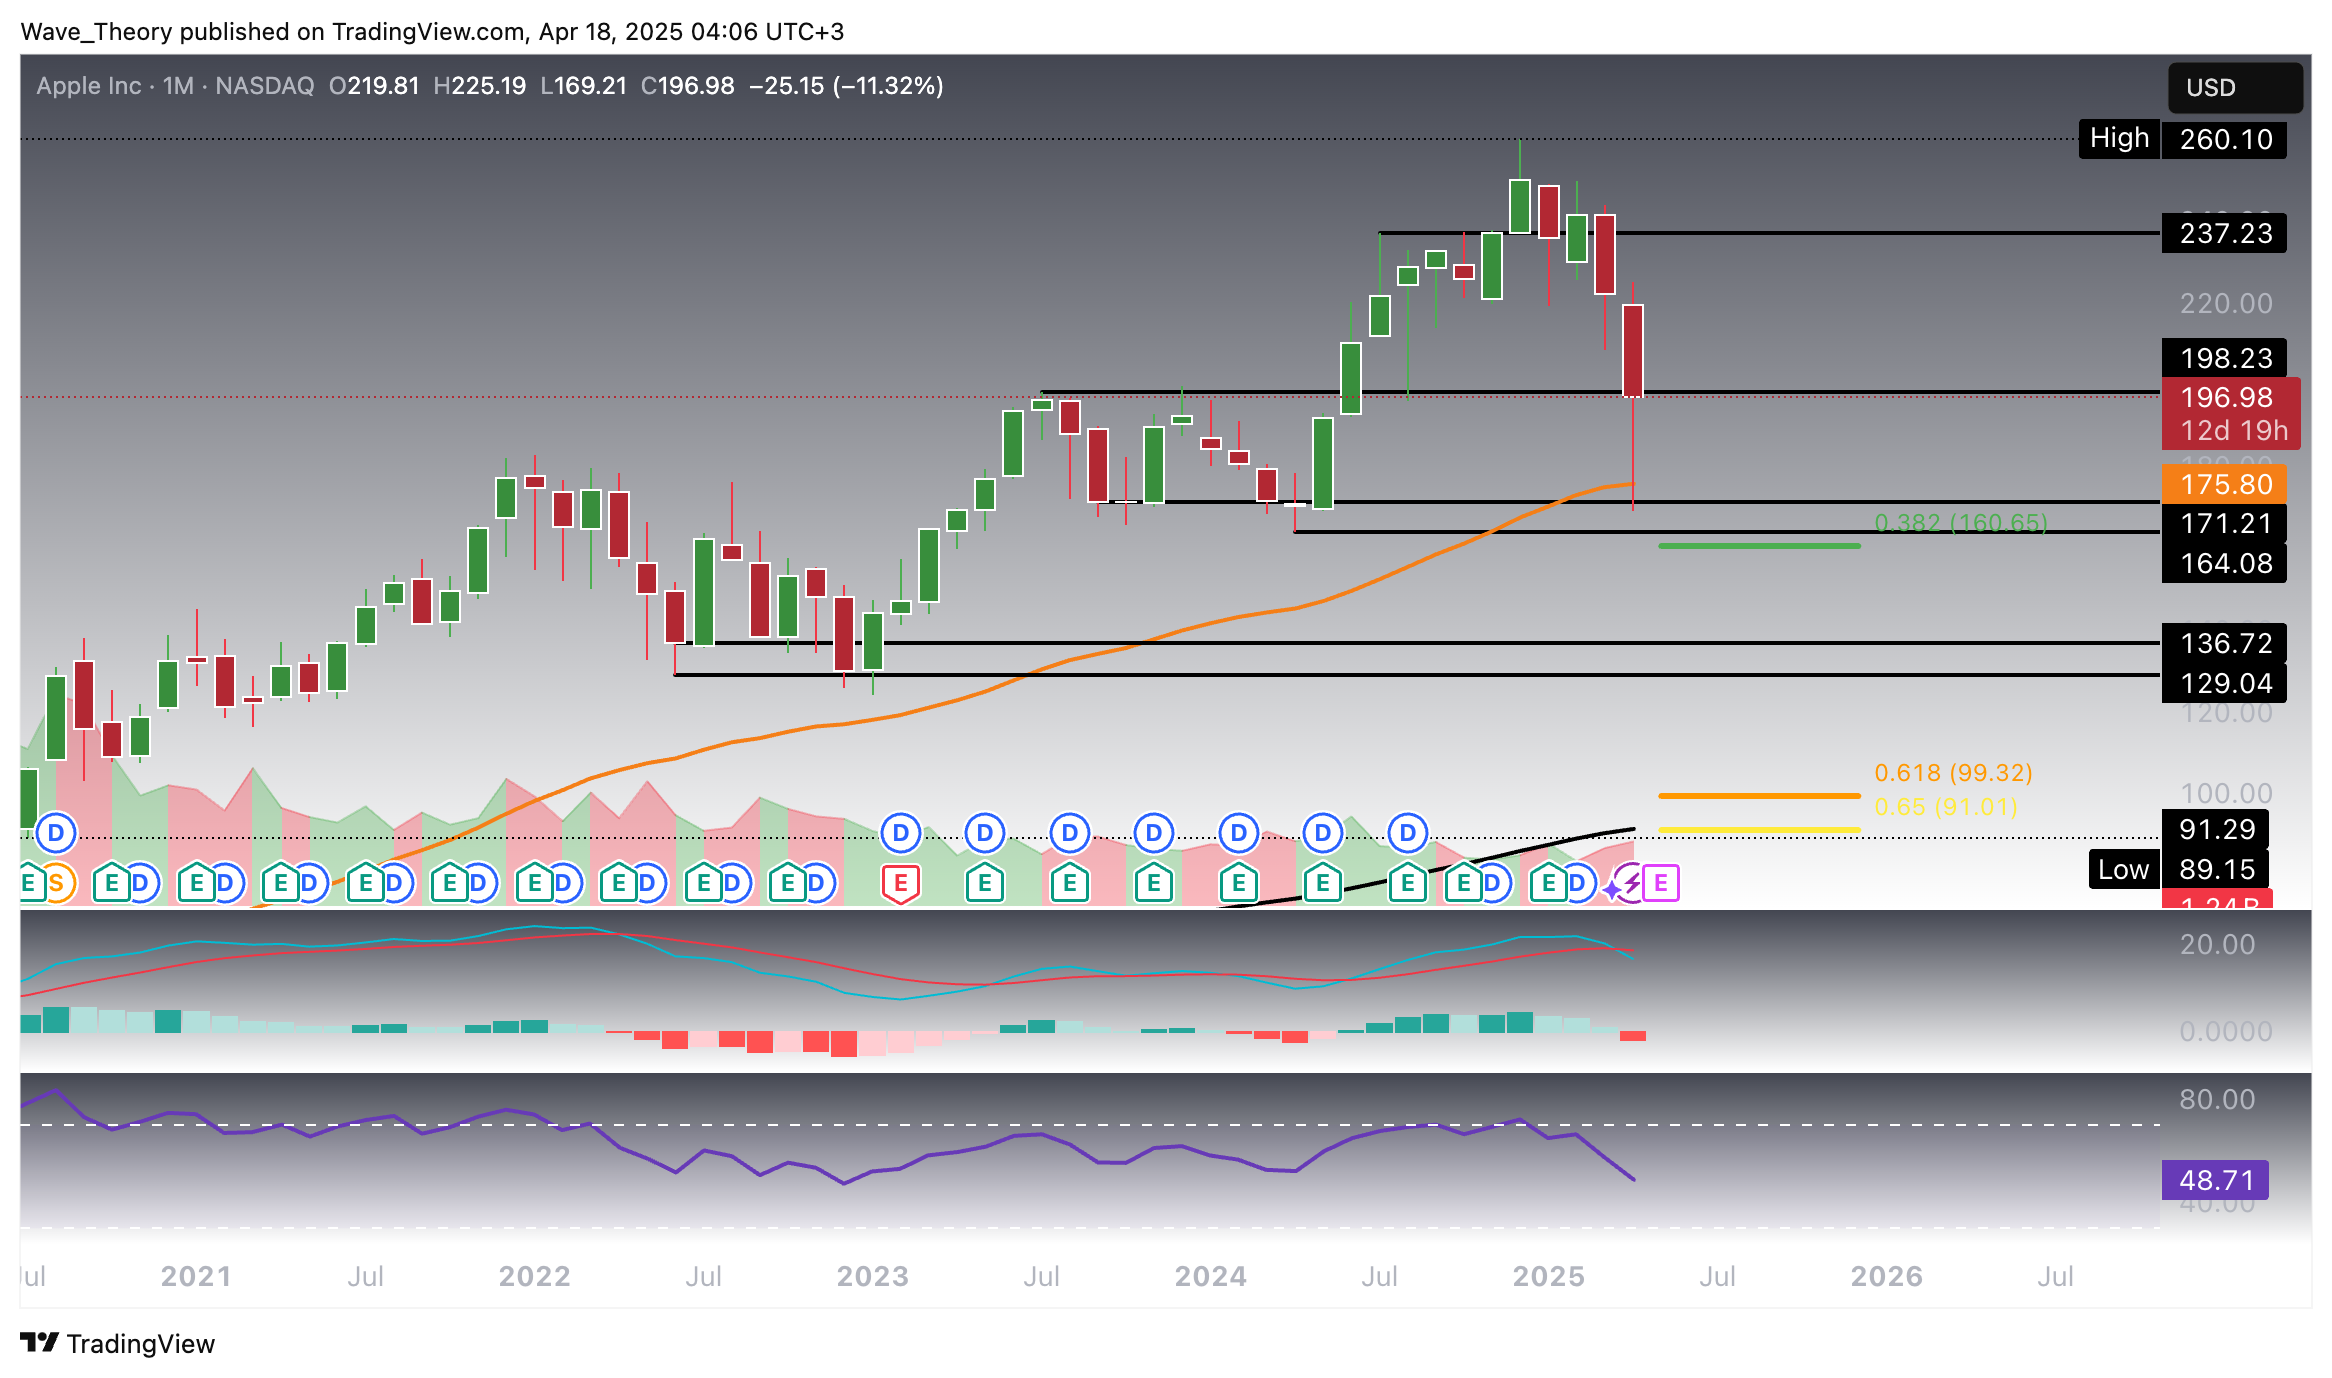
Apple Stock Tests 50-Month EMA Support After 35% Pullback
Following a substantial 35% correction, Apple Inc. (AAPL) has entered a significant support zone between $164 and $171, with the 50-month EMA providing additional support around $175.8. This month, AAPL has responded with a bullish bounce off this zone. However, caution is warranted as the MACD lines remain bearishly crossed, and the histogram continues its four-month downward trajectory. Meanwhile, the RSI fluctuates in neutral territory, offering no clear directional bias. Despite short-term weakness, the EMAs on the monthly chart maintain a golden crossover, indicating that the long-term bullish trend remains intact.
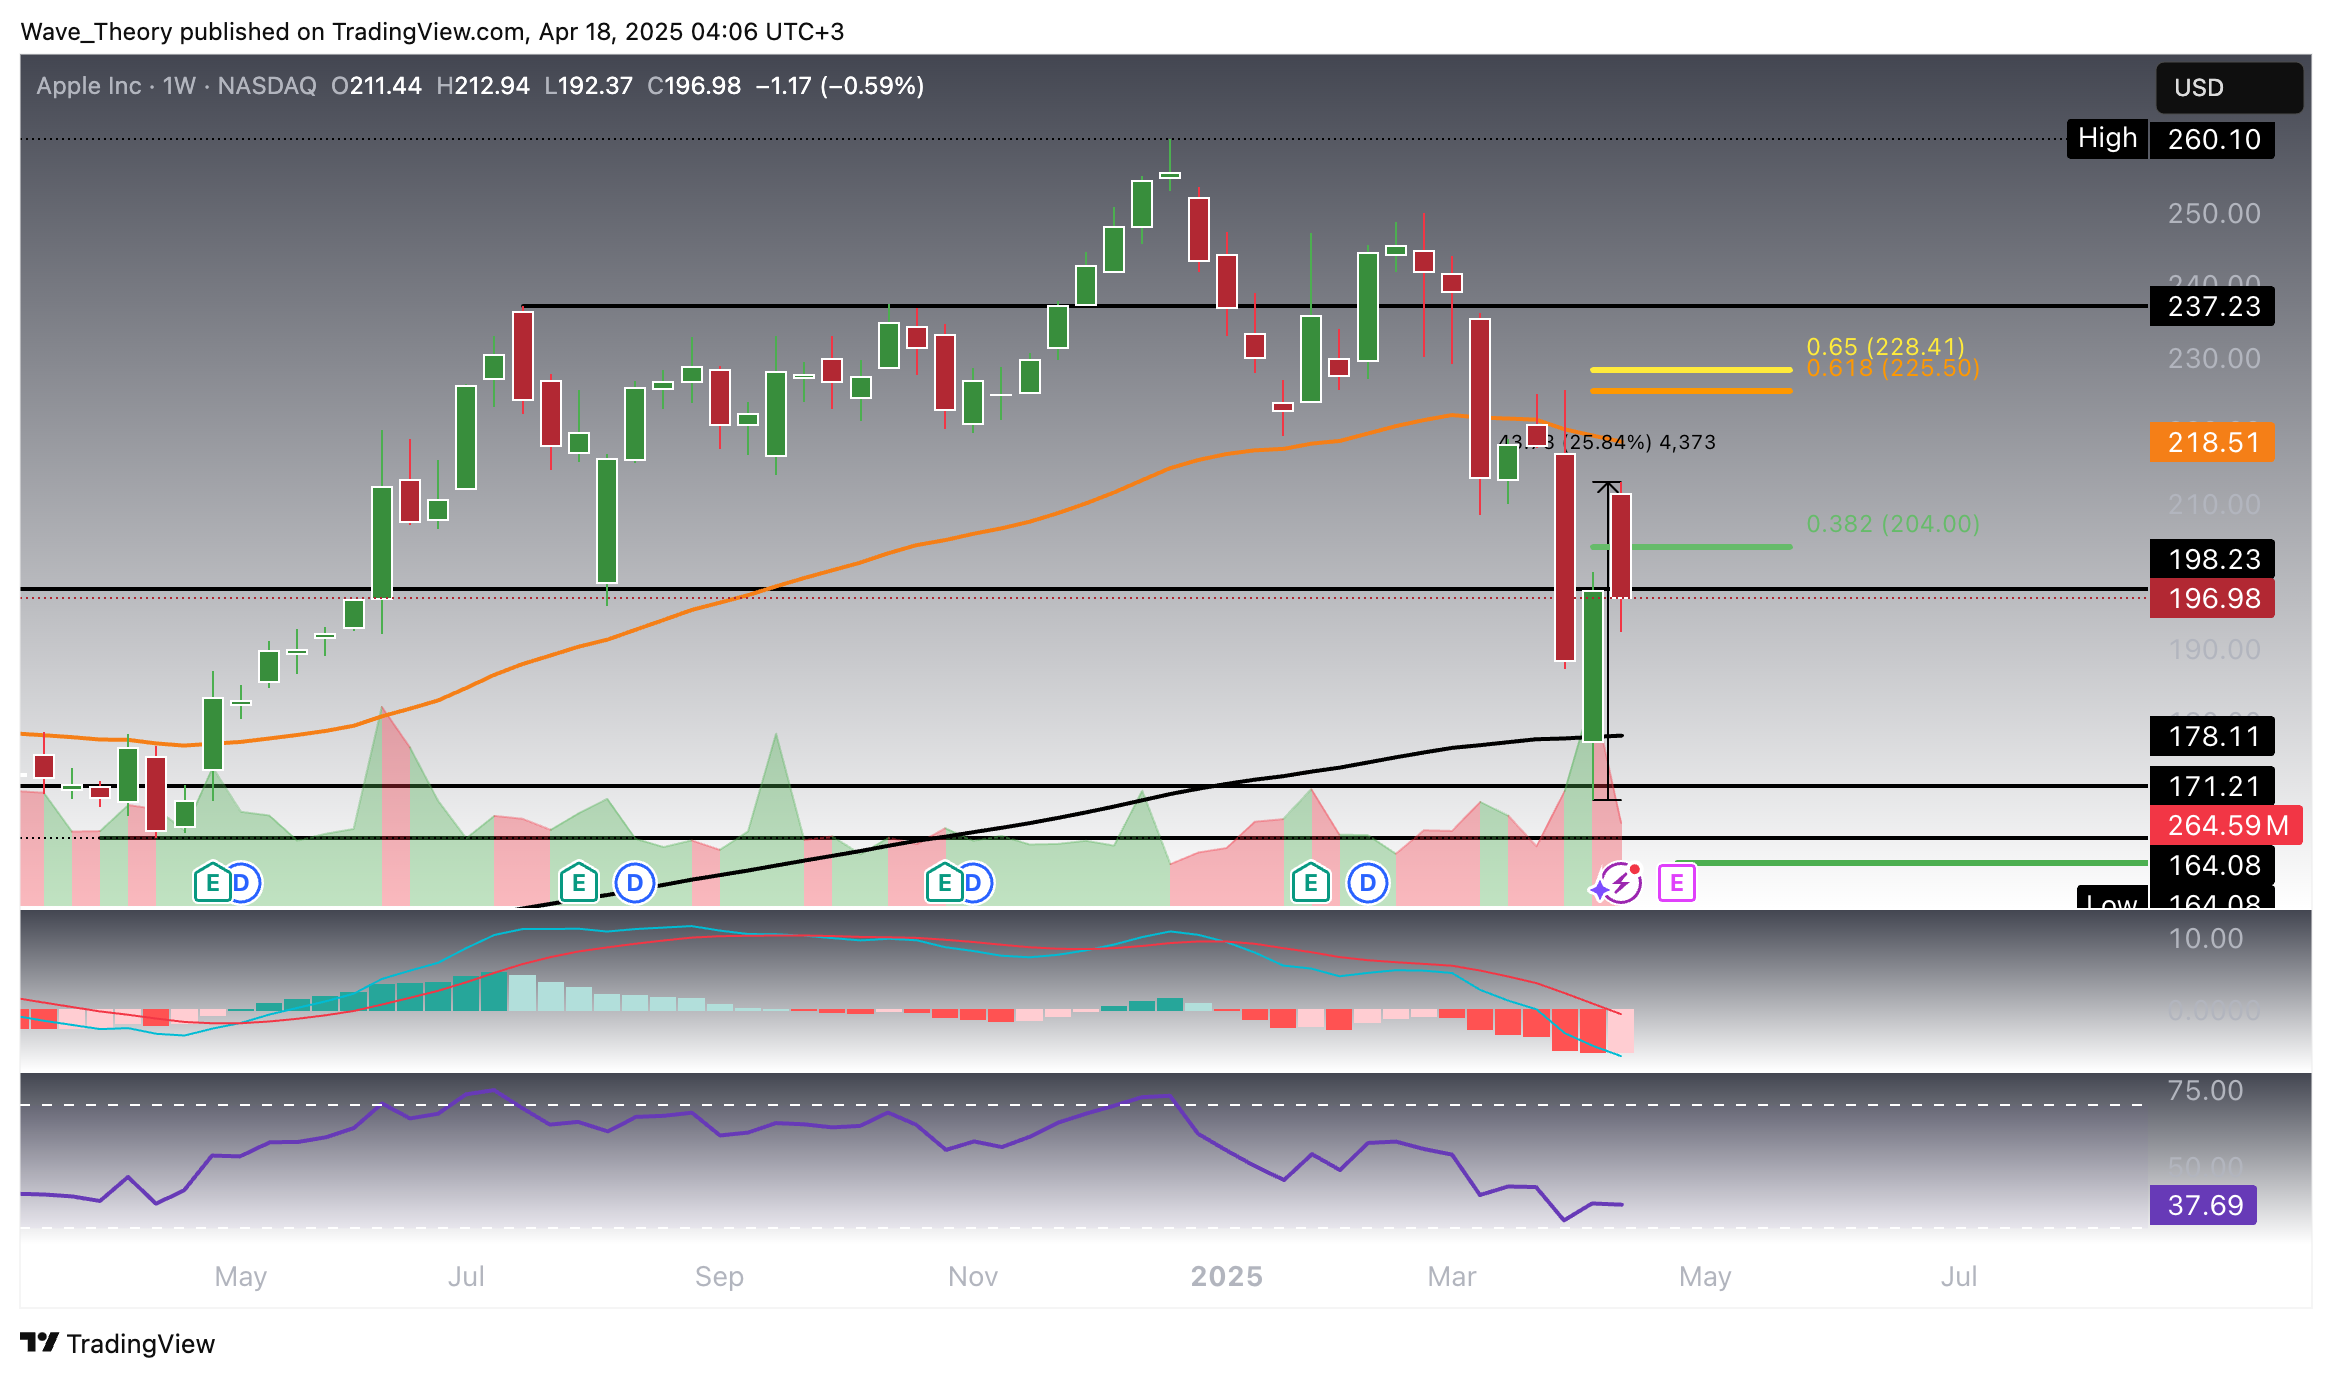
Apple (APPL) Stock Rebounds 26% and Approaches Key Fibonacci Resistance
Apple Inc. (AAPL) has rebounded sharply, gaining approximately 26% over the past two weeks and breaking above the 0.382 Fibonacci resistance level at $204. A sustained close above this level could open the path toward the next major resistance zones at the 50-week EMA around $218.5 and the golden ratio near $228.
Technically, the indicators paint a mixed picture. The EMAs continue to exhibit a golden crossover, signaling a bullish mid-term trend. The MACD histogram has turned positive, ticking higher this week, suggesting growing bullish momentum. However, the MACD lines remain bearishly crossed, and the RSI hovers in neutral territory, offering no definitive direction.
Apple’s correction phase will likely remain in play unless it successfully breaches the golden ratio resistance at $228.
AAPL
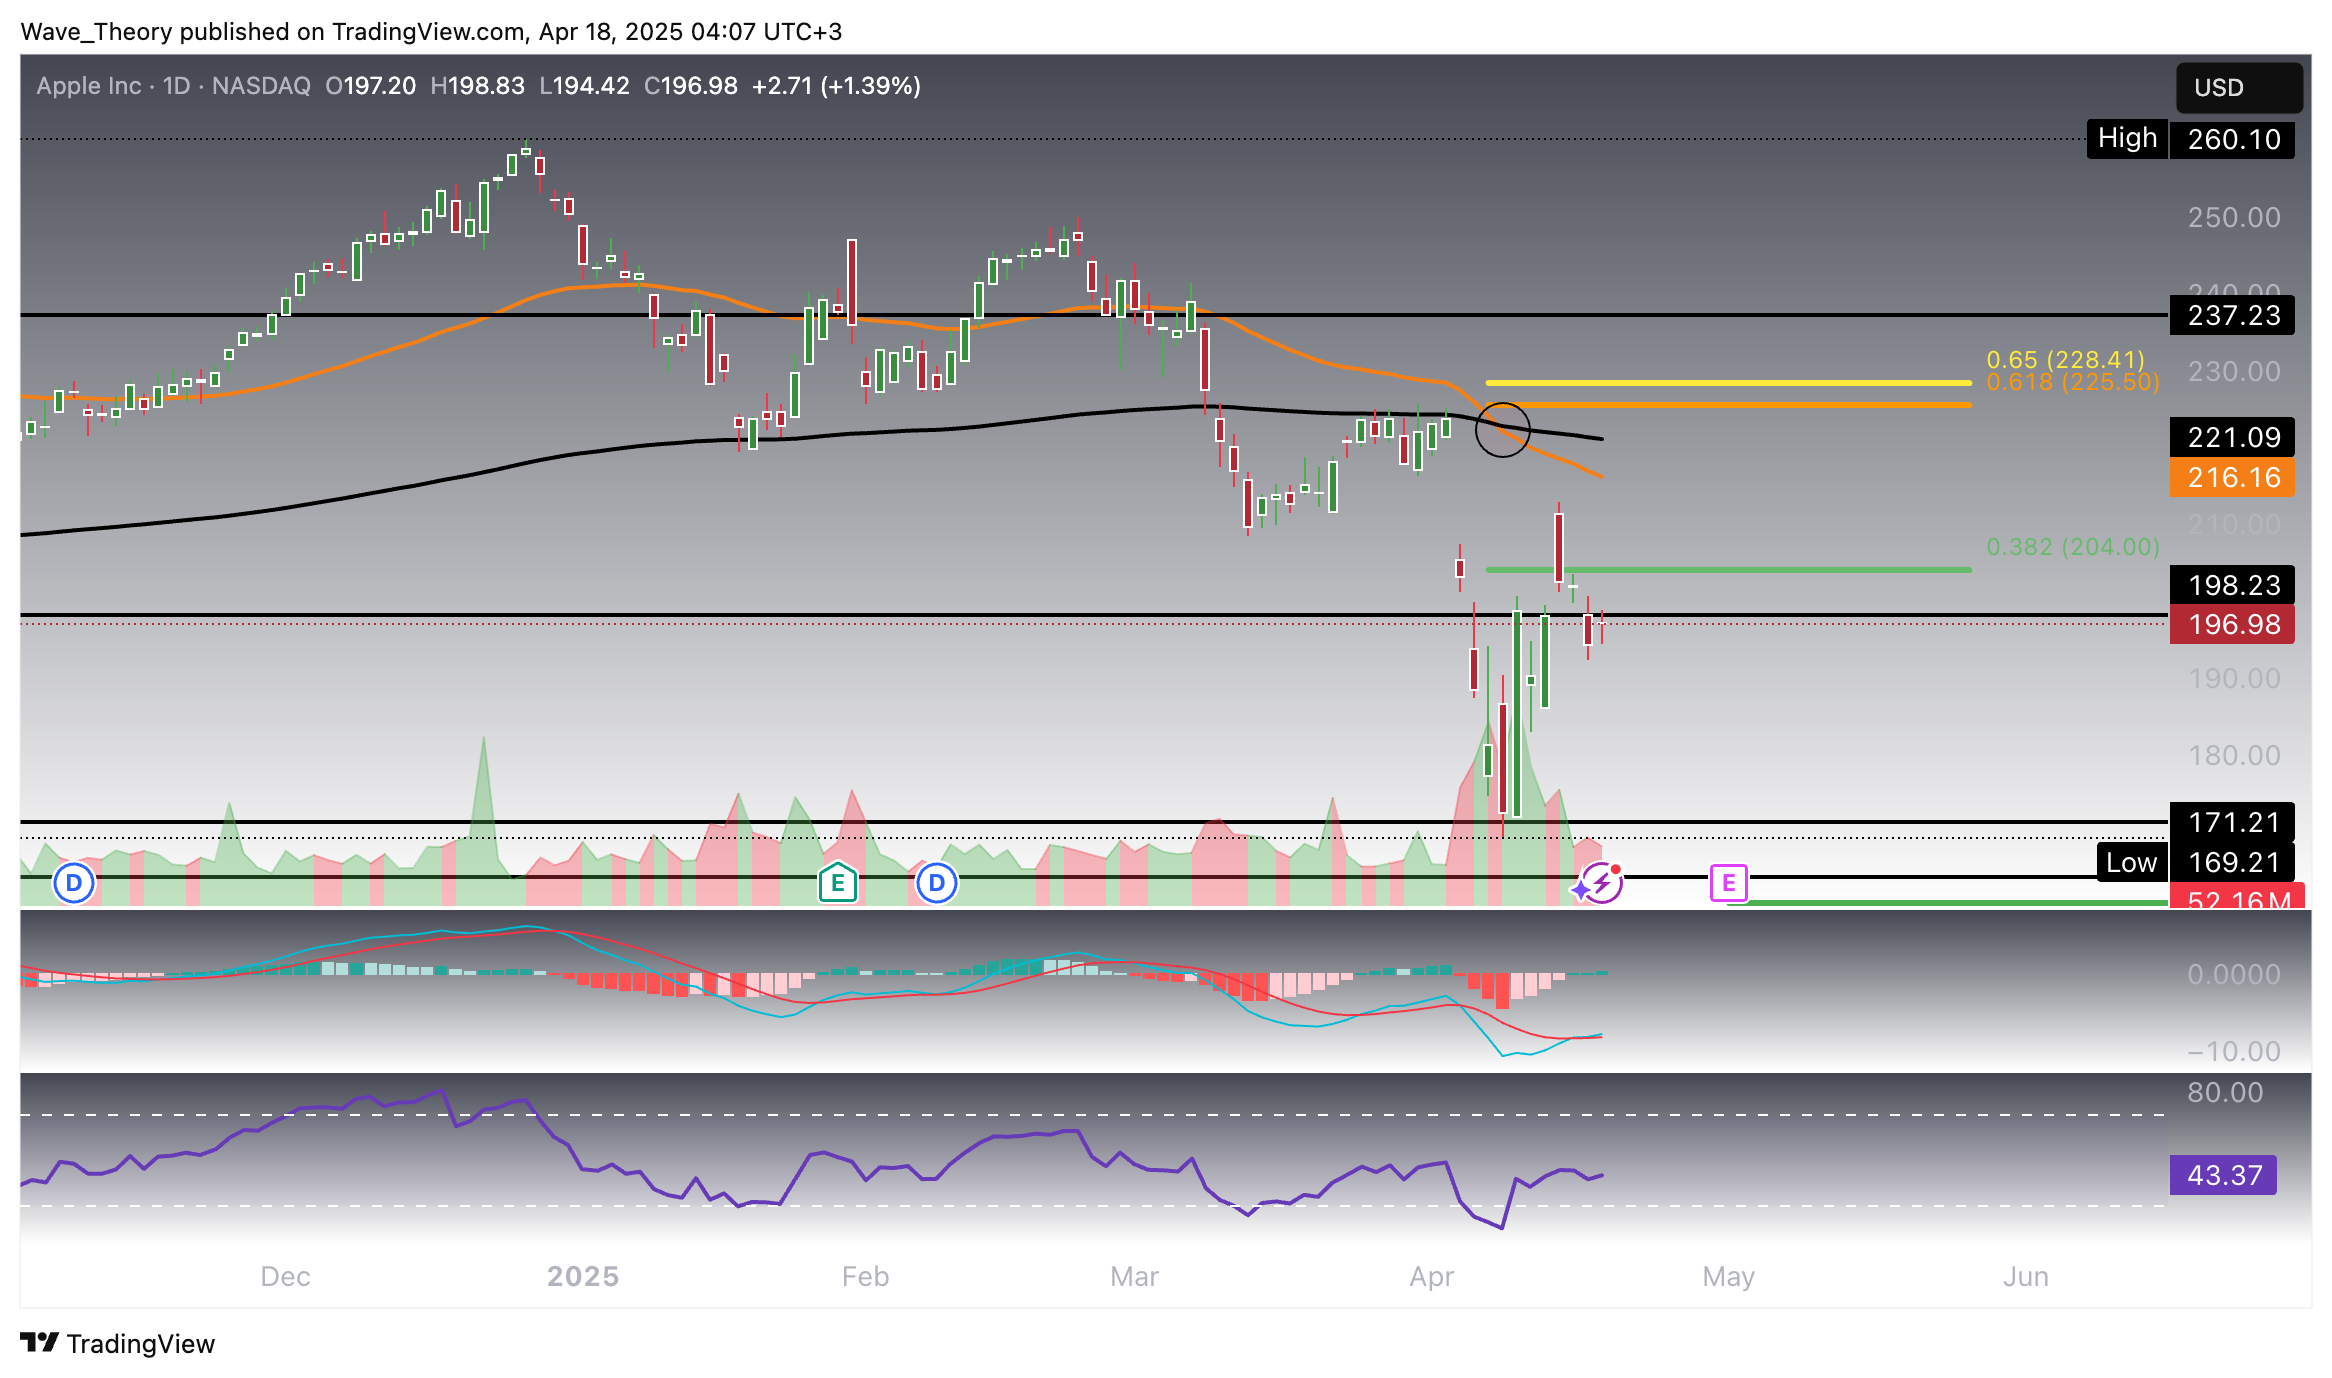
Apple Daily Chart: Death Cross Signals Short-Term Bearish Pressure
On the daily chart, Apple’s technical outlook remains mixed. The MACD histogram is ticking higher and the MACD lines are bullishly crossed, indicating short-term upward momentum. However, the EMAs have recently formed a death cross, suggesting bearish pressure in the short- to medium term. Meanwhile, the RSI continues to move in neutral territory, offering no clear directional bias.
If Apple fails to decisively break above the upcoming resistance levels, a retest of the key support zone between $164 and $171 remains a likely scenario.
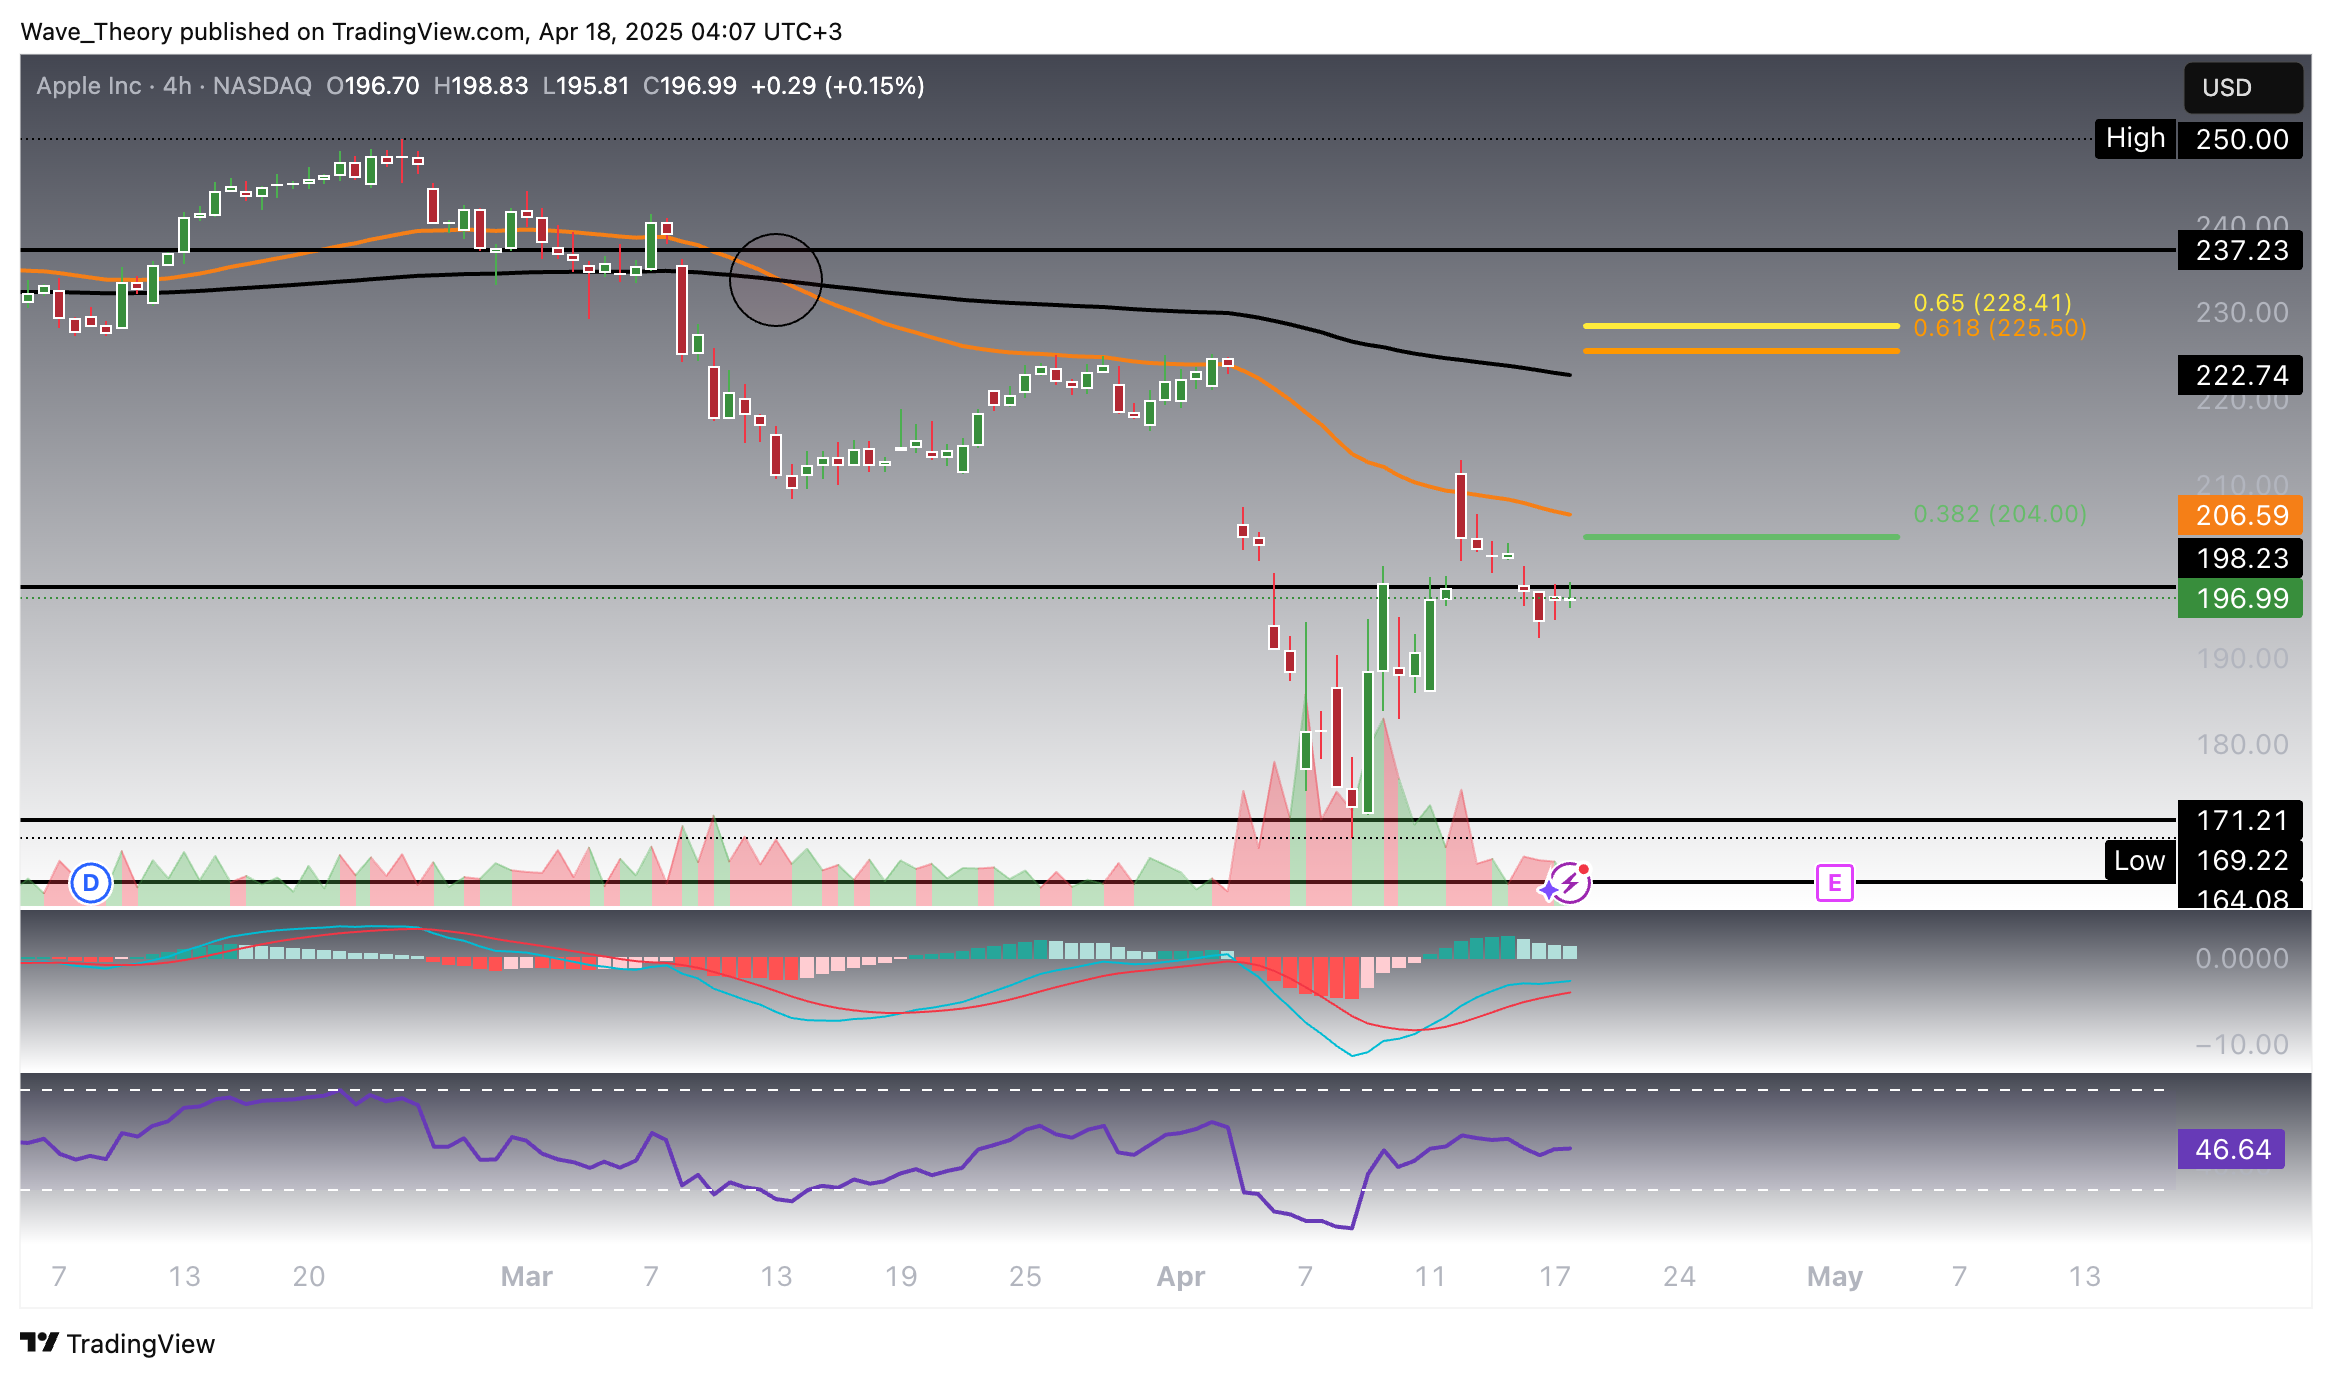
Apple 4H Chart: Short-Term Resistance Builds Amid Bearish EMA Cross
The 4H chart reflects a similarly mixed technical picture. A death cross between the EMAs confirms a bearish short-term trend, while the MACD histogram is ticking lower, indicating weakening bullish momentum. However, the MACD lines remain bullishly crossed, and the RSI holds steady in neutral territory, suggesting indecision among market participants.
Currently, Apple (AAPL) is facing strong resistance at key Fibonacci levels, with the 50-4H EMA at $206.6 and the 200-4H EMA at $222.7 acting as additional resistance barriers.
- Check out our free forex signals
- Follow the top economic events on FX Leaders economic calendar
- Trade better, discover more Forex Trading Strategies
- Open a FREE Trading Account
Related Articles


Comments
Sidebar rates
Related Posts
