Oil Jumps 2%—WTI Eyes $67 Breakout on Iran Heat
After two weeks in the red, oil is finally up. West Texas Intermediate (WTI) is above $62.50, up 2% on the week, its first weekly gain...
Quick overview
- Oil prices have rebounded after two weeks of decline, with West Texas Intermediate (WTI) now above $62.50, marking its first weekly gain since early April.
- The increase is attributed to tightening supply, rising geopolitical tensions, and US sanctions against Iran's oil trade targeting Chinese refiners.
- WTI is testing resistance at $63.65, and if it breaks above $63.70 on strong volume, prices could rise to $65.67 or $67.20.
- However, macroeconomic concerns, including lowered oil demand forecasts due to trade war impacts, could pose risks to this bullish momentum.
After two weeks in the red, oil is finally up. West Texas Intermediate (WTI) is above $62.50, up 2% on the week, its first weekly gain since early April.

What’s behind the rebound? A mix of tightening supply and rising geopolitical tension.
The US has doubled down on sanctions against Iran’s oil trade, this time targeting Chinese refiners tied to Tehran. Meanwhile, OPEC members like Iraq and Kazakhstan are pledging deeper production cuts to offset previous overproduction.
Add to that signs of emerging fuel shortages—US refineries are drawing down gasoline and distillate stocks—and you’ve got a recipe for bullish momentum.
But there’s a big “if”. The World Trade Organization just cut its 2025 trade growth forecast to -0.2%, down from 3%, and growth could stall.
WTI Technical Picture: Bulls Target $63.65 Breakout
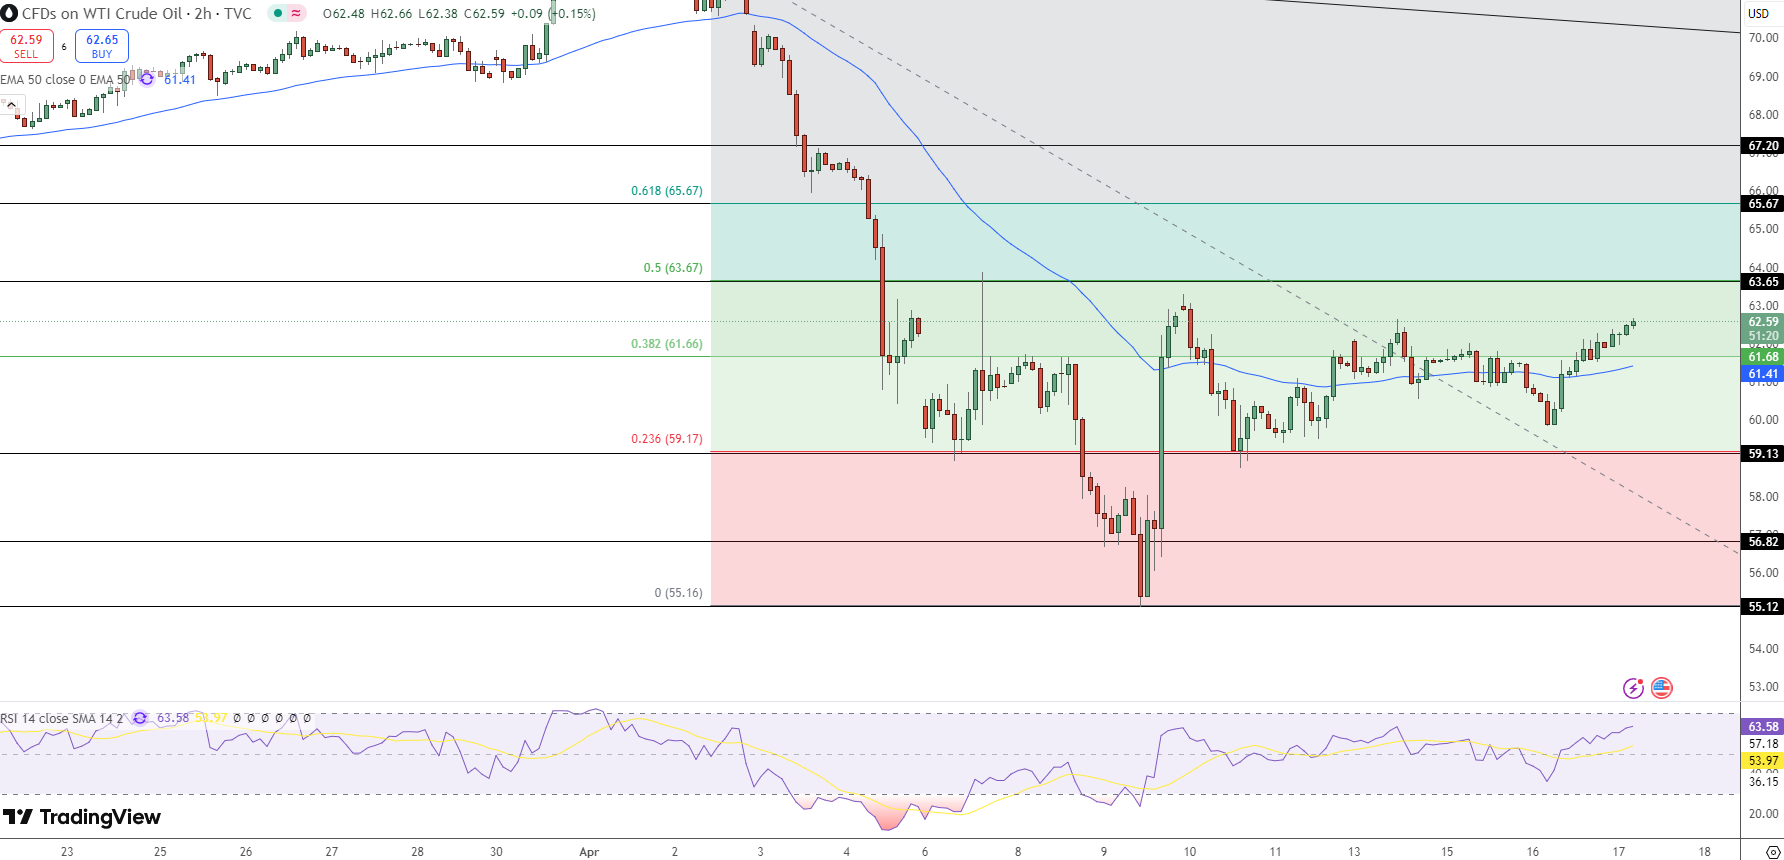
On the charts, WTI is building strength. The price has taken out the 50-period EMA ($61.41) and is testing resistance at $63.65, the 38.2% Fibonacci retracement from the recent decline.
RSI is 63.5—bullish but not overbought—so there’s room to run if momentum holds
If WTI breaks above $63.70 on strong volume, we could see $65.67 and even $67.20. But if resistance holds, support is at $61.66 and $59.13.
Trade Setup: Beginner-Friendly
Entry: Buy on breakout above $63.70
Targets: $65.67 and $67.20
Stop Loss: Below $61.40
Tip: Look for a strong close above resistance with good volume before entering.
This is a low-risk trade that lets you ride the current momentum—perfect for waiting for confirmation.
What to Watch
While supply cuts and sanctions are driving the current move, macro headwinds could still pull the rug out. Goldman Sachs and JPMorgan are trimming oil demand forecasts due to trade war fallout and global growth risks.But if WTI gets through $63.65, the way is clear for a short-term breakout—especially if Middle East tensions heat up or refinery supplies stay tight.
In a nutshell: Bulls are in control for now—but be prepared to pivot. The next move may depend as much on DC and Beijing as Vienna and Tehran.
- Check out our free forex signals
- Follow the top economic events on FX Leaders economic calendar
- Trade better, discover more Forex Trading Strategies
- Open a FREE Trading Account
Related Articles
Comments
Sidebar rates
Related Posts
