Nvidia
Nvidia Stock Bullish Bounce: Is a Breakout Rally Just Getting Started?
Konstantin Kaiser•Thursday, April 17, 2025•2 min read

Quick overview
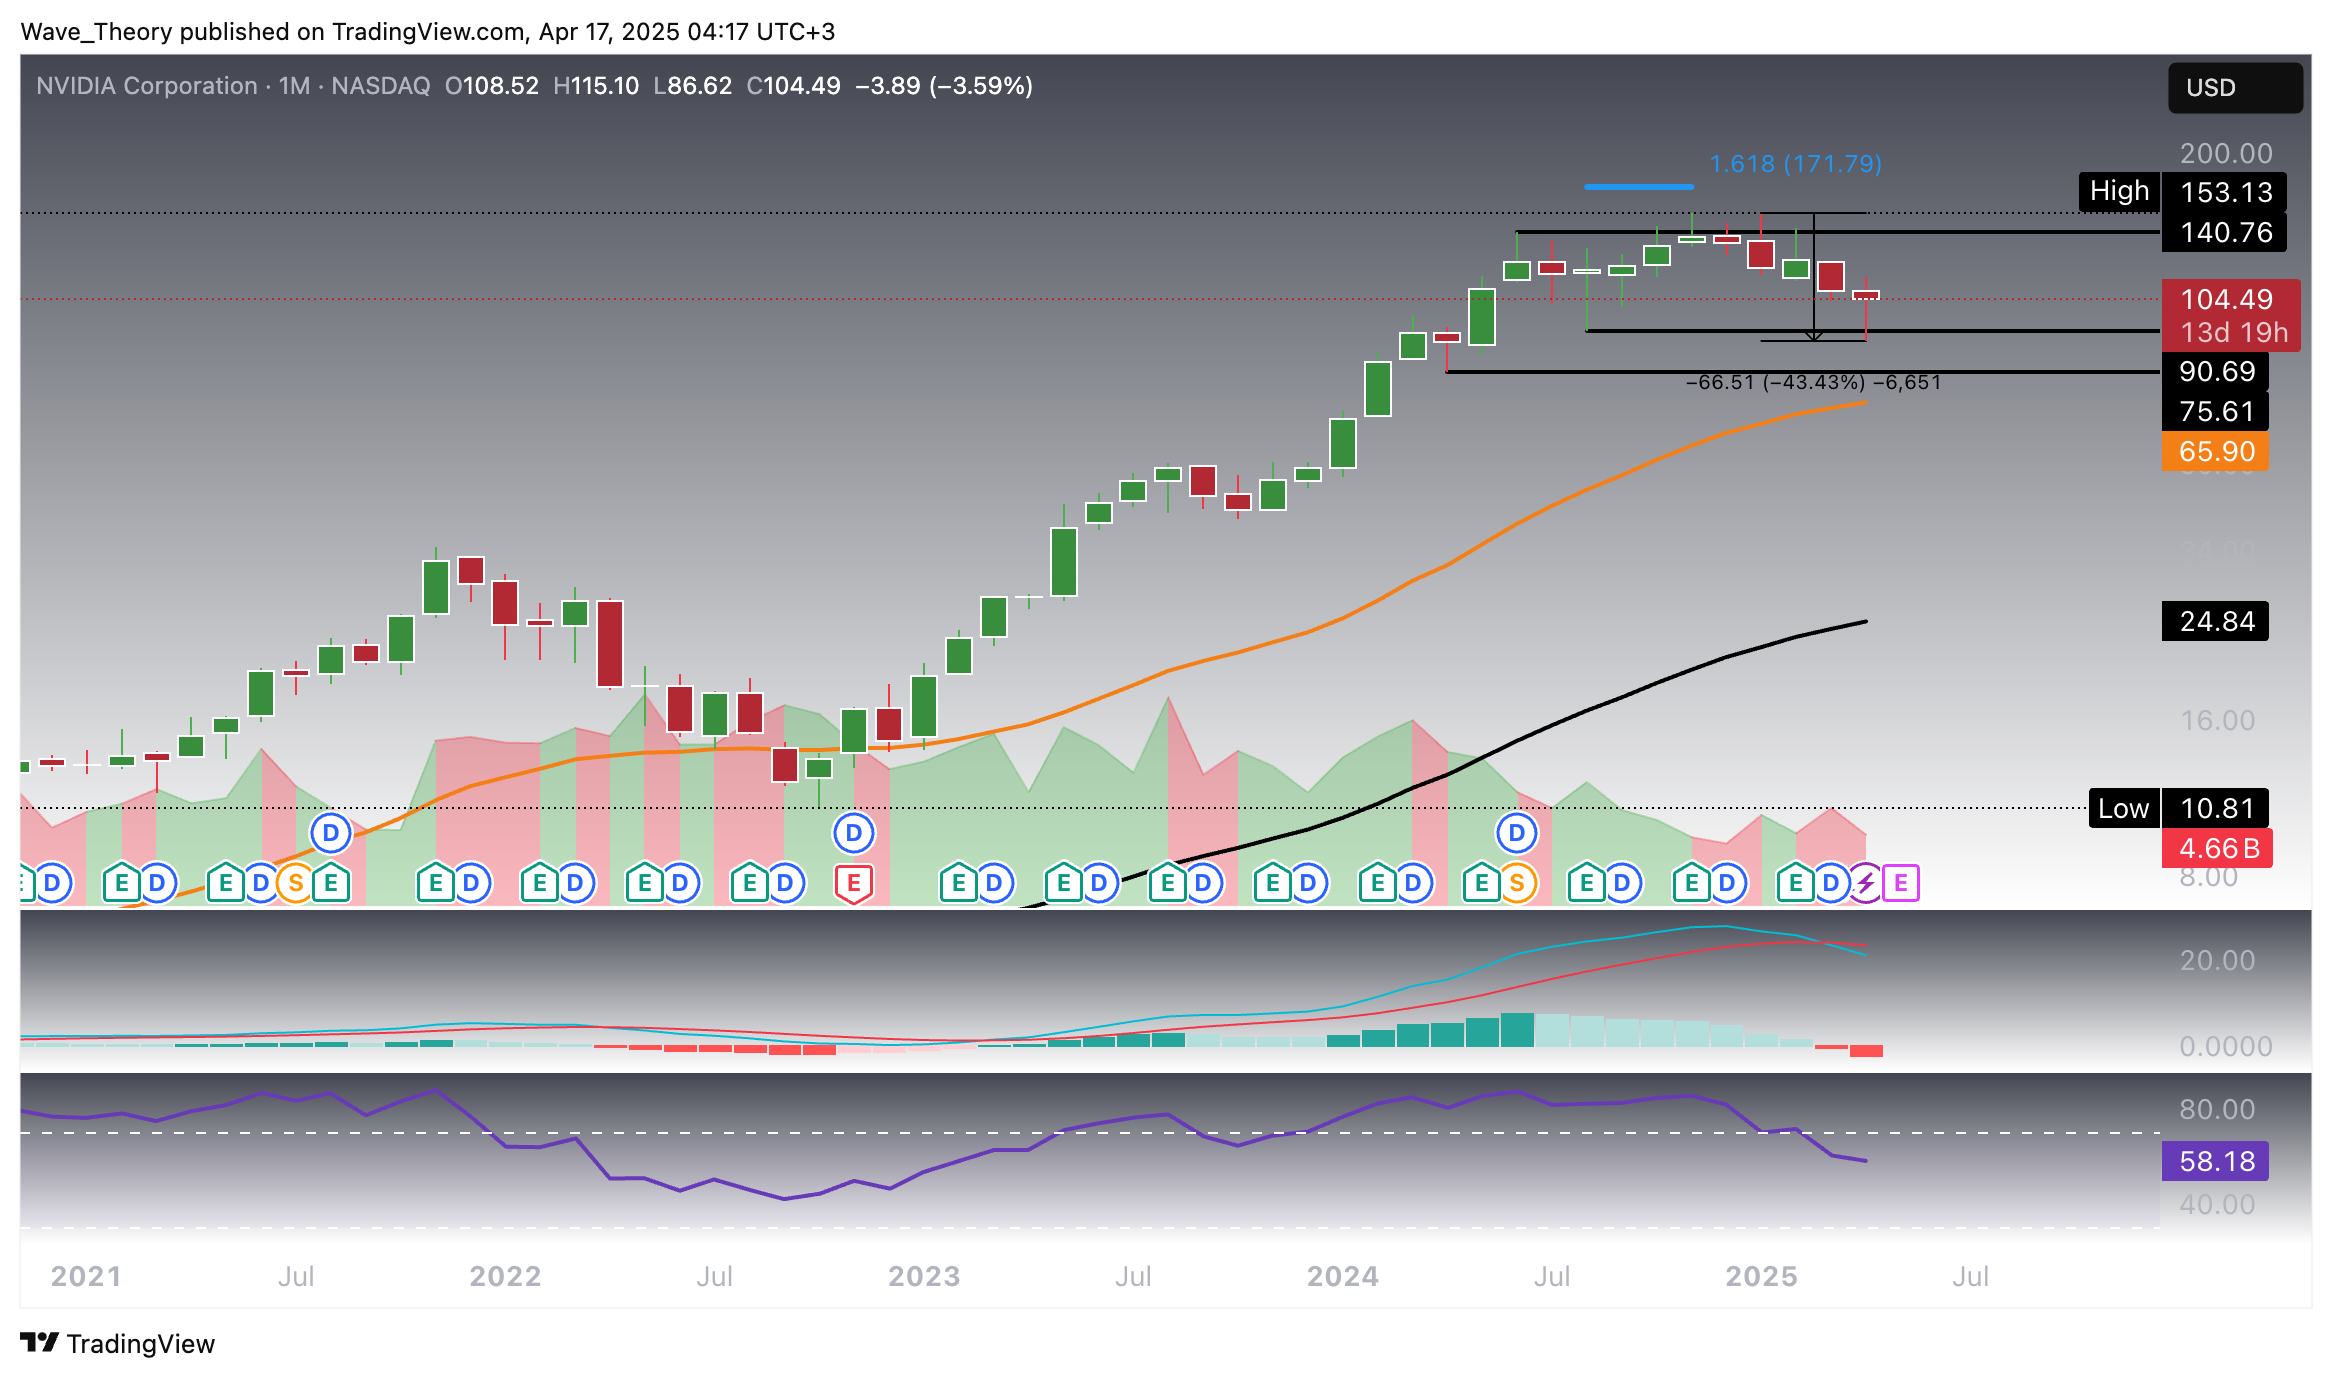
- Nvidia (NVDA) has experienced a 43.43% decline from its all-time high, entering a critical support zone between $75.6 and $90.7.
- Recent price action suggests potential bullish reversal signs, although underlying indicators show mixed momentum.
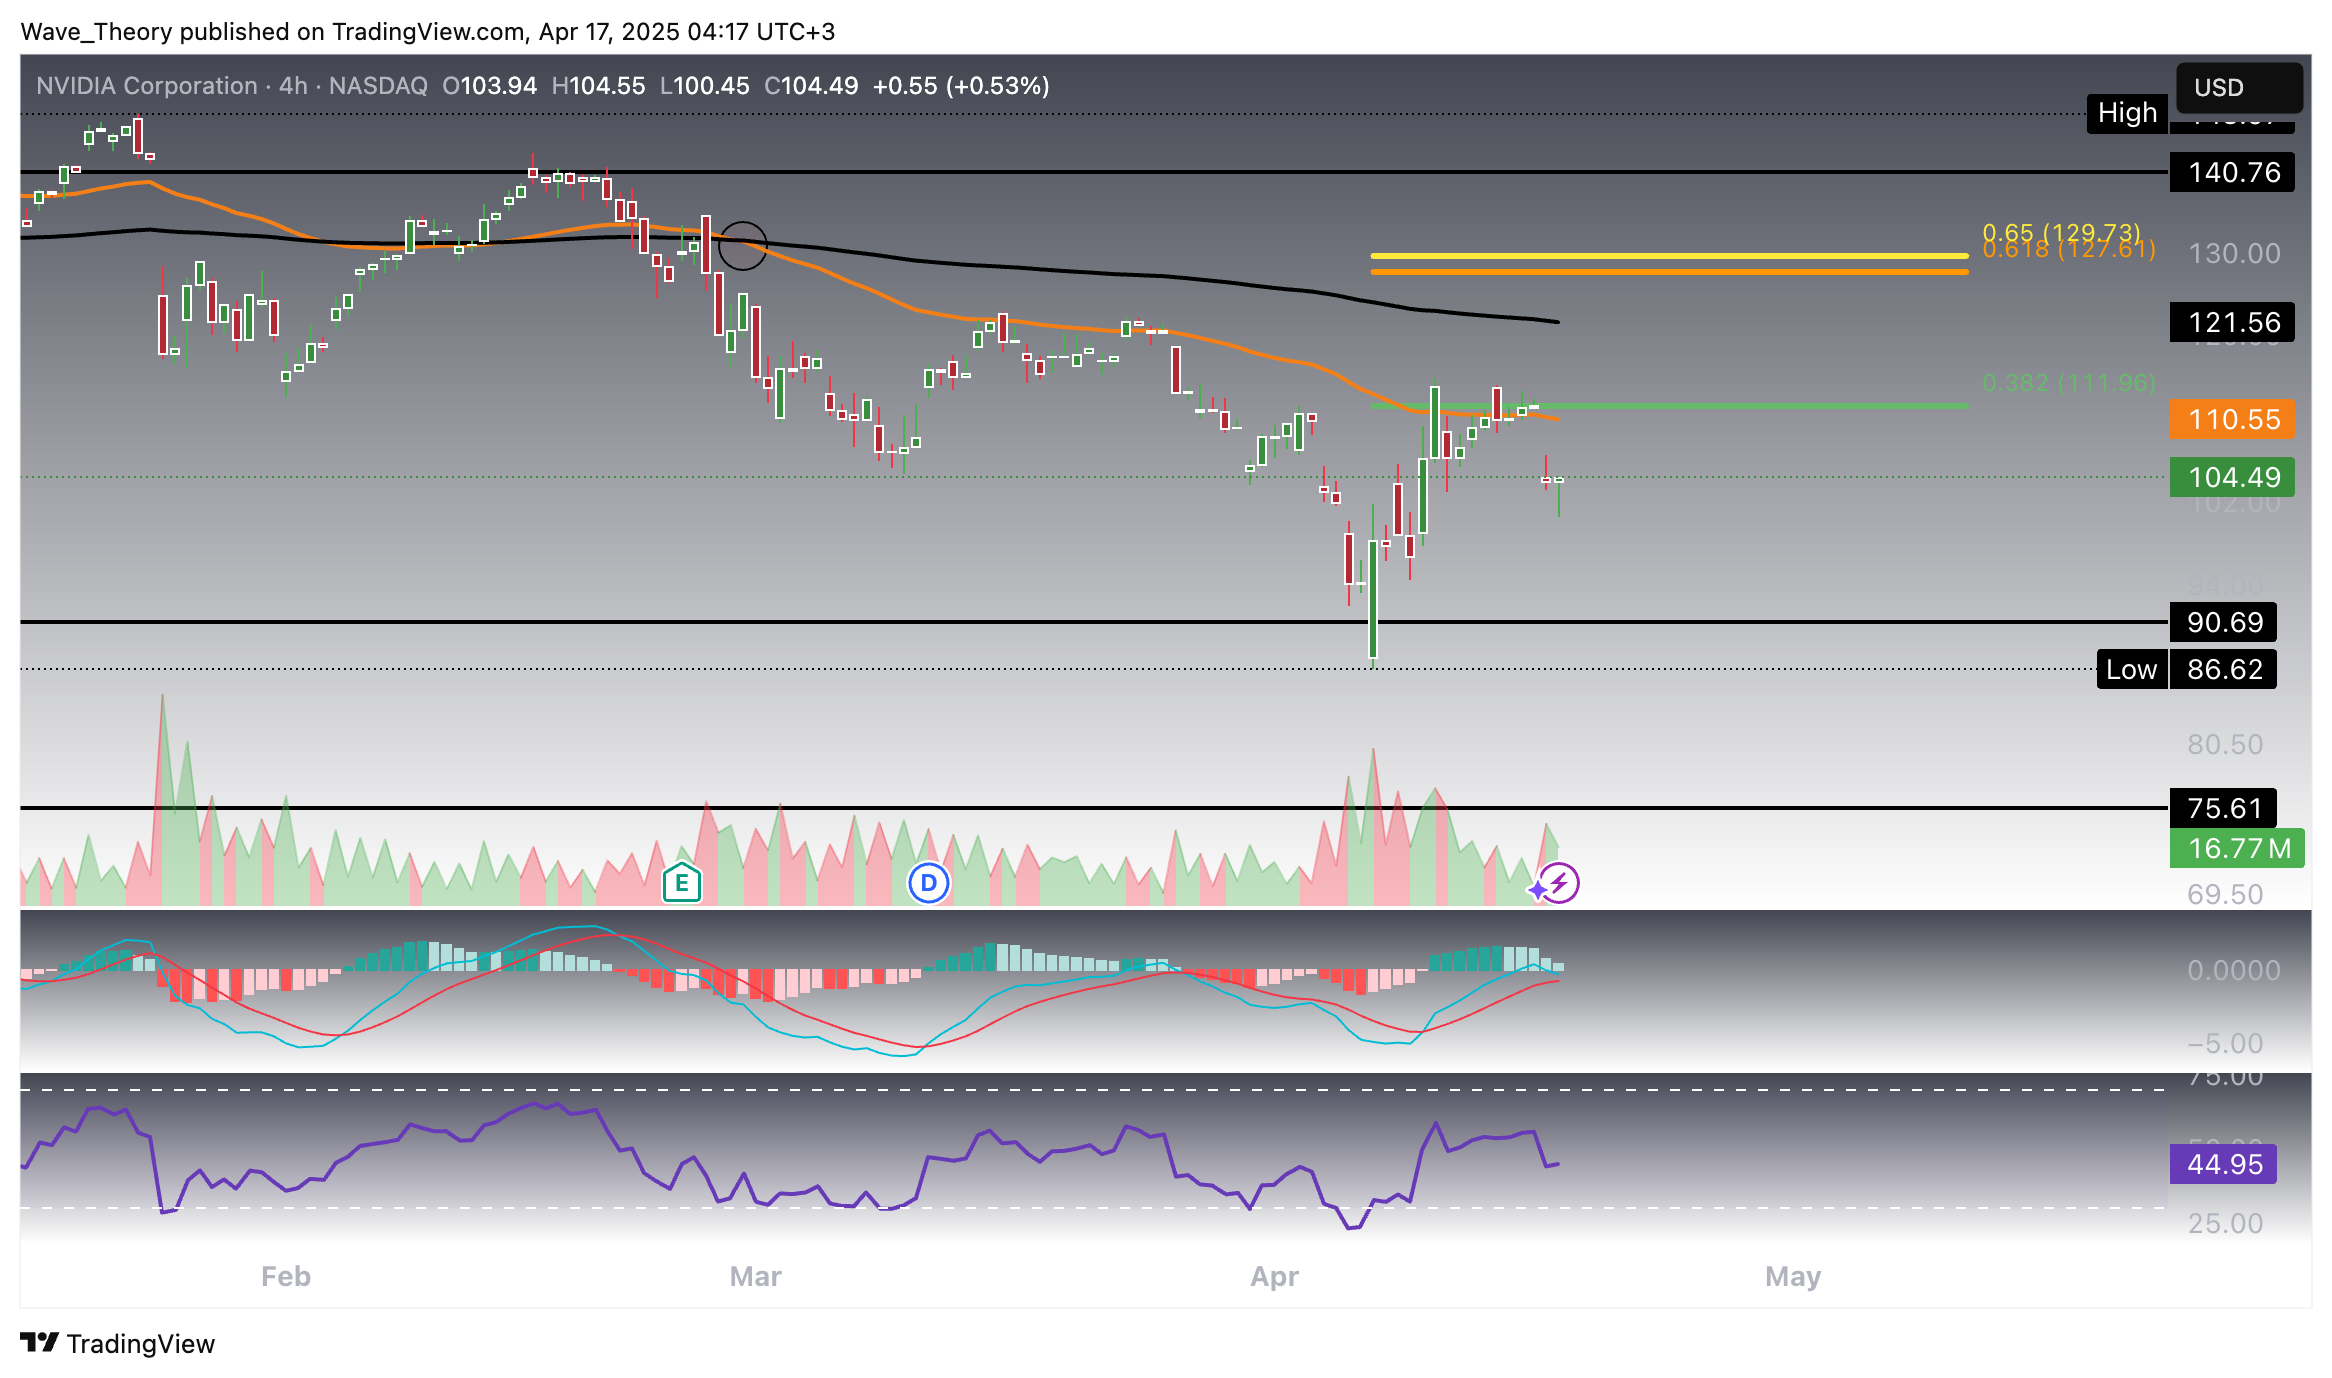
- The stock faces key resistance at the 0.382 Fibonacci level and the 50-week EMA, with a need to break above $130 to invalidate the current correction phase.
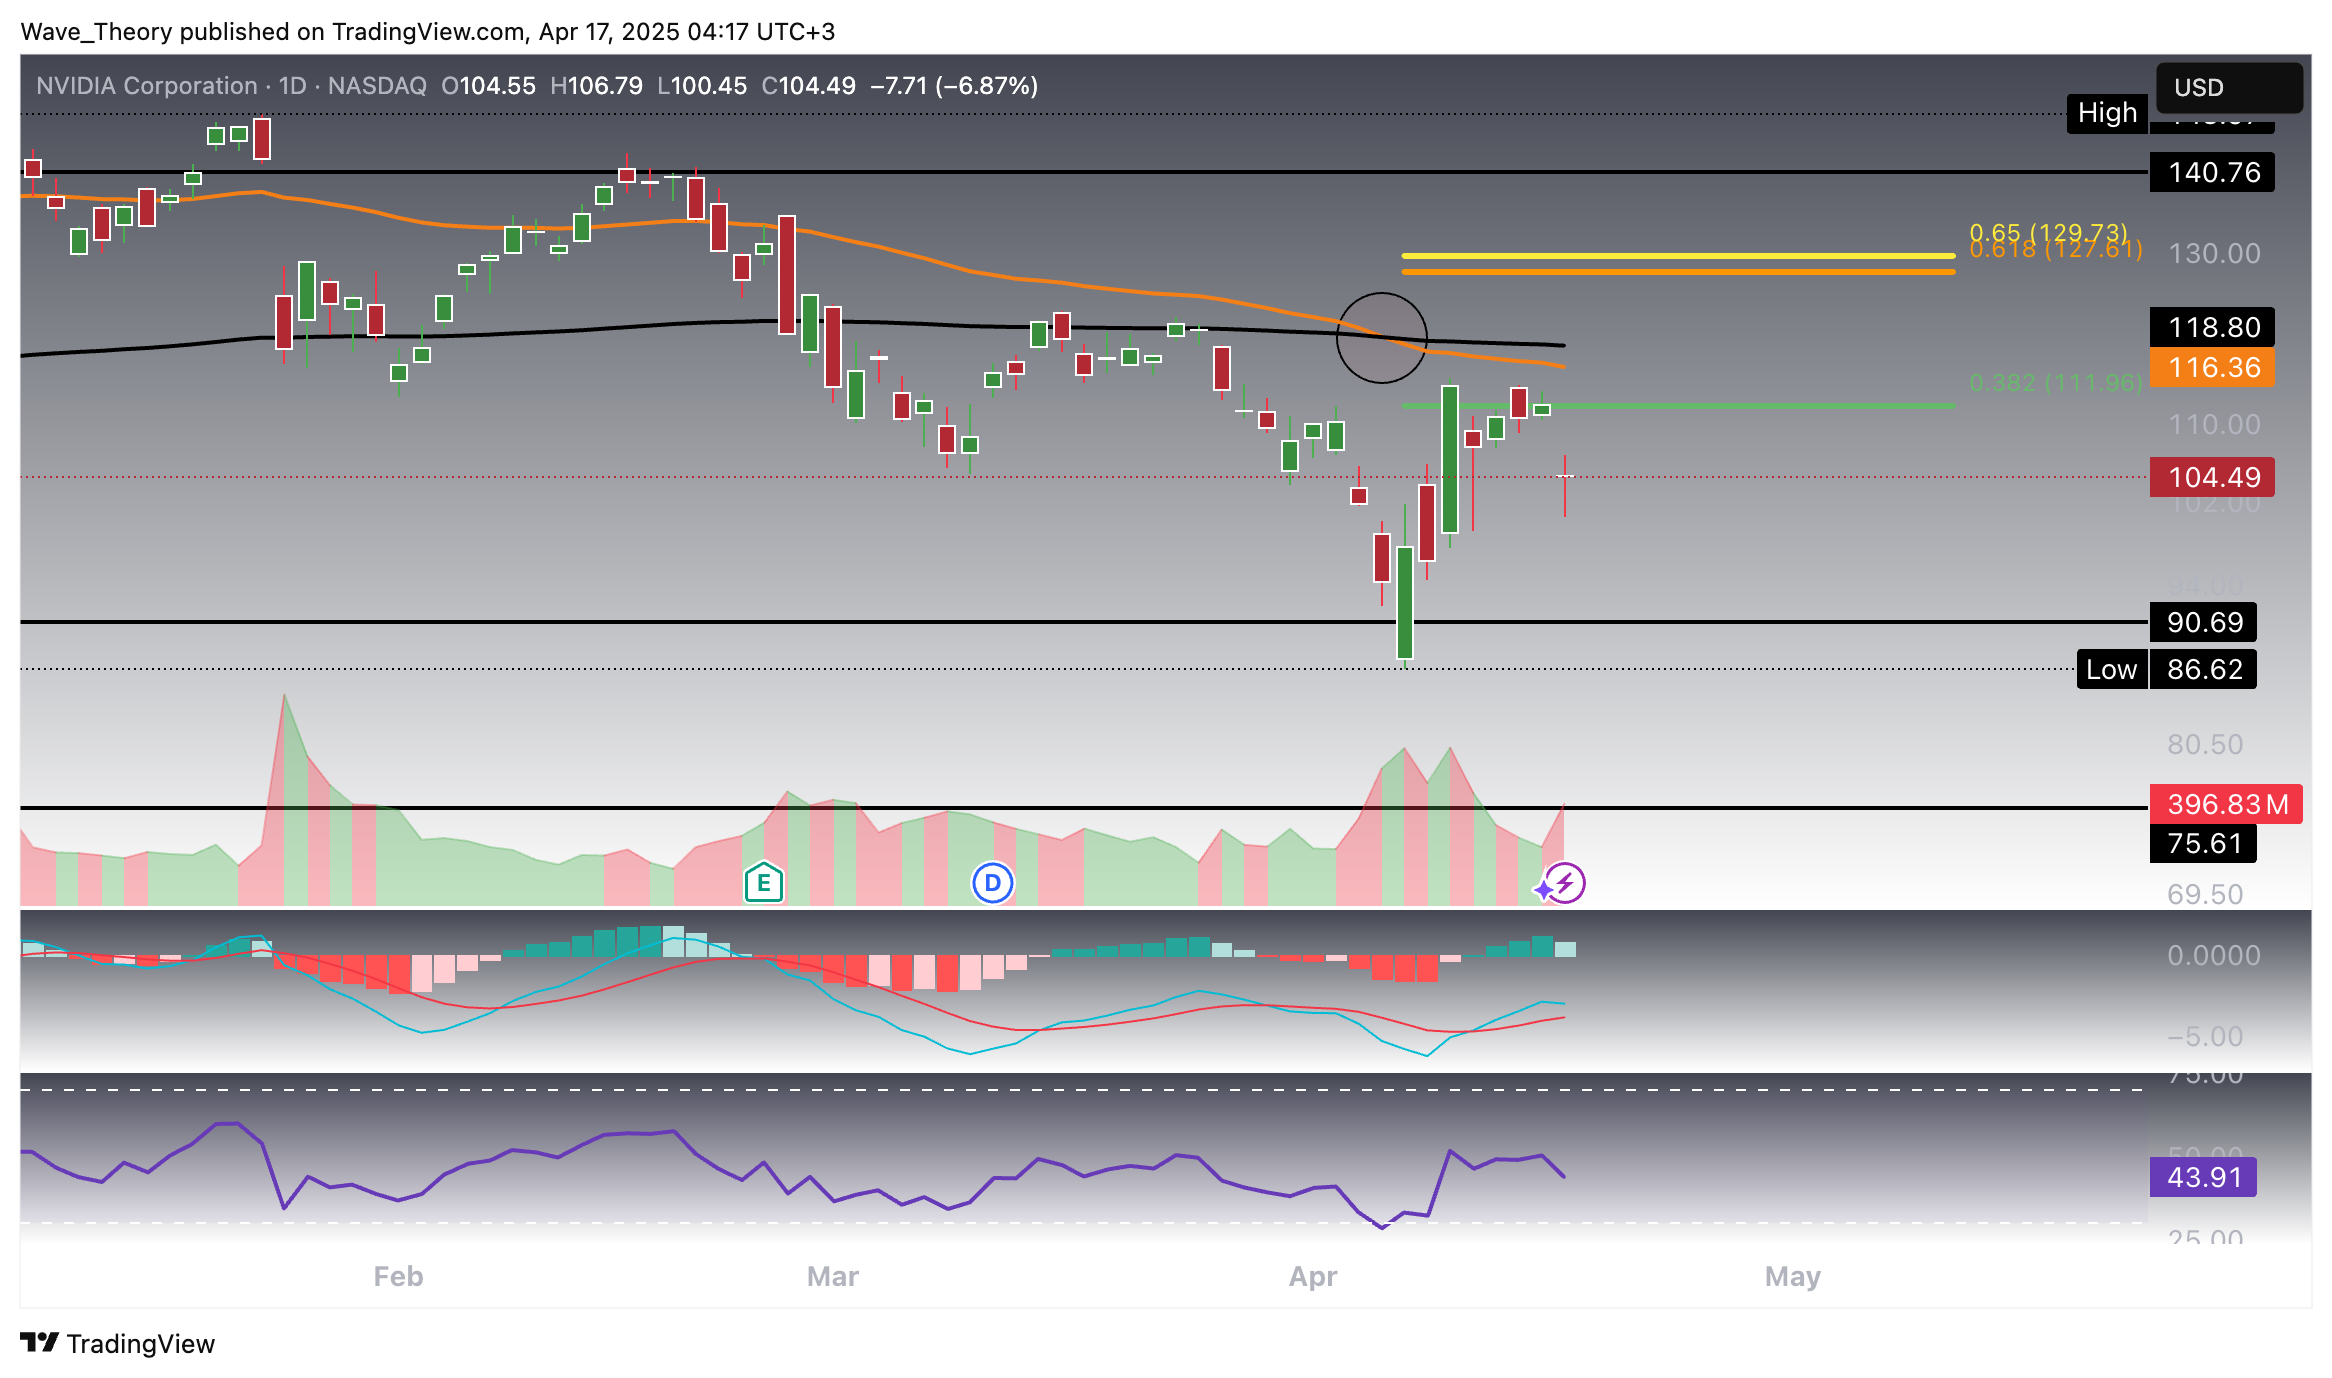
- Short-term charts indicate bearish trends, including a death cross formation, while the MACD shows early signs of bullish divergence.
Over the past four months, Nvidia (NVDA) has undergone a notable correction, declining by approximately 43.43% from its all-time high. This sustained retracement has brought the stock into a critical support zone between $75.6 and $90.7. Recent price action suggests a potential bounce from this demand area, hinting at the early stages of a bullish reversal. However, while price behavior appears constructive, the underlying indicators provide a more nuanced picture.
Monthly Technical Outlook: Indicators Signal Mixed Momentum
MACD (Moving Average Convergence Divergence)
The MACD lines remain crossed bearishly, confirming bearish momentum in the medium term. Additionally, the histogram continues to tick bearishly lower, reinforcing the ongoing downward pressure. Despite this, any reduction in bearish momentum could signal a weakening of the selling trend and a possible setup for a bullish crossover in the near future.
RSI (Relative Strength Index)
The RSI is hovering in neutral territory, currently offering no strong directional signal. This indicates that the stock is neither oversold nor overbought, and traders should look for a breakout or divergence to confirm directional conviction.
EMA (Exponential Moving Averages)
Despite the recent correction, the EMA structure remains technically bullish. The presence of a golden crossover (where the short-term EMA remains above the long-term EMA) underscores the long-term uptrend and reinforces the idea that the current decline may be corrective rather than trend-reversing
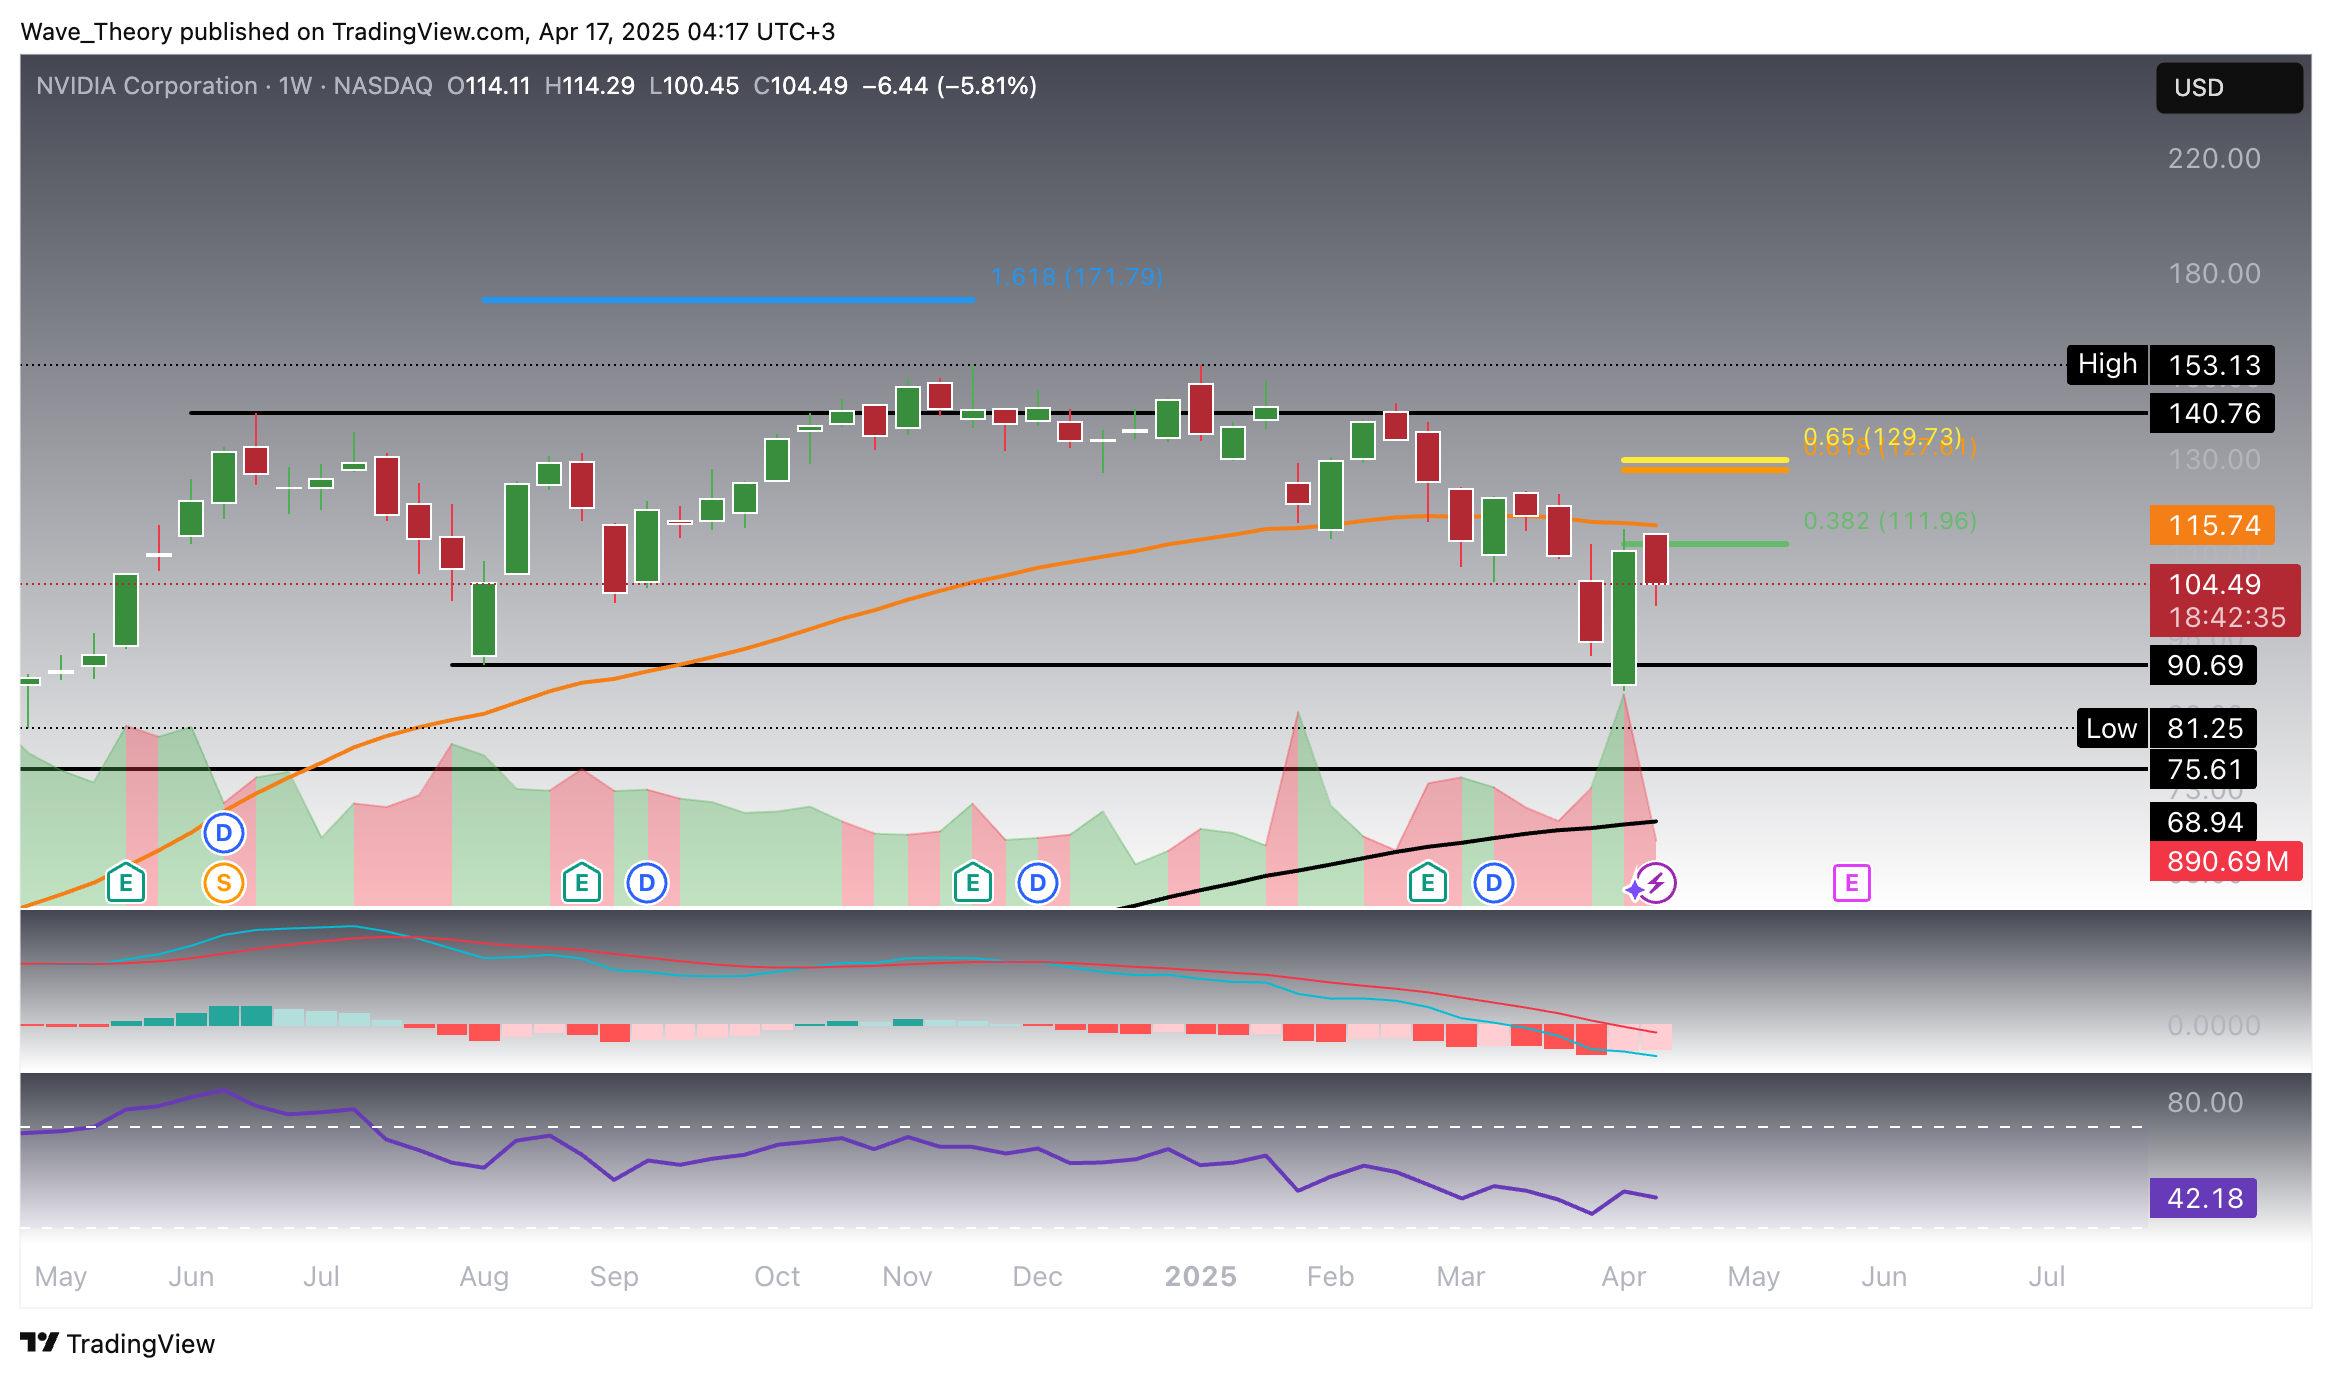
Nvidia Faces Key Fibonacci and EMA Resistance on Weekly Chart
On the weekly timeframe, Nvidia (NVDA) is encountering critical resistance between the 50-week EMA and the 0.382 Fibonacci retracement level, located in the $112–$116 range. Following a strong 33% rally last week, the stock appears to be facing initial rejection at this confluence zone—raising the possibility of a pullback toward the broader support range between $75.6 and $90.7.
From a momentum perspective, the MACD lines remain bearishly crossed; however, the histogram has started to tick higher, suggesting early bullish divergence. The EMAs continue to maintain a golden crossover, supporting a medium-term bullish trend, while the RSI remains neutral and directionless.
- Check out our free forex signals
- Follow the top economic events on FX Leaders economic calendar
- Trade better, discover more Forex Trading Strategies
- Open a FREE Trading Account
ABOUT THE AUTHOR
See More
Konstantin Kaiser
Financial Writer and Market Analyst
Konstantin Kaiser comes from a data science background and has significant experience in quantitative trading. His interest in technology took a notable turn in 2013 when he discovered Bitcoin and was instantly intrigued by the potential of this disruptive technology.
Related Articles


Comments
Subscribe
Login
Please login to comment
0 Comments
Oldest
Sidebar rates
Related Posts
