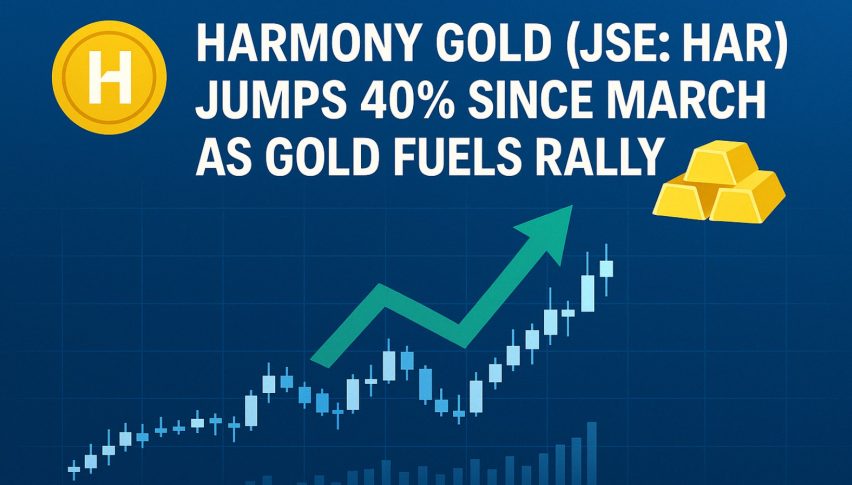
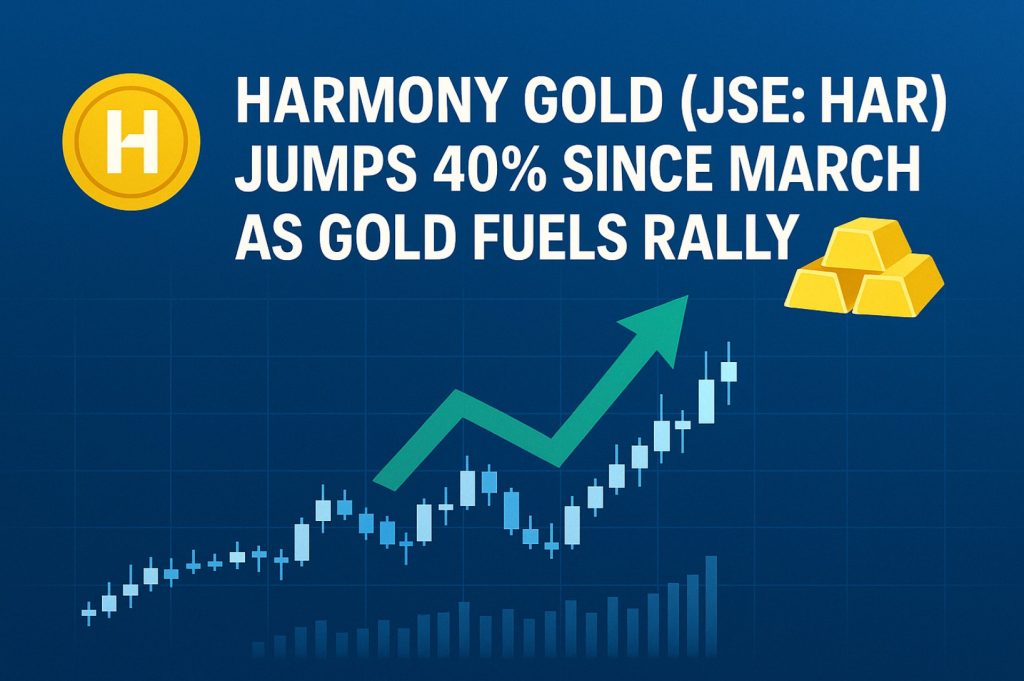
Harmony Gold Stock (JSE: HAR) Surges 40% as Gold (XAU) Rally Lifts JSE Top 40
Harmony Gold (JSE: HAR) jumps 40% as record gold prices drive investor interest. JSE up 7% YTD. Is HAR overbought—or just getting started?
Quick overview
- Harmony Gold (JSE: HAR) has surged 40% since March, making it one of the top performers on the JSE this year.
- The rally is fueled by increasing global demand for gold amid trade tensions and a weakening US dollar.
- Despite the bullish trend, technical indicators suggest that the stock may be overbought, indicating a potential pullback.
- Traders are advised to wait for a dip to key support levels before entering the market.
Harmony Gold (JSE: HAR) has risen 40% since March and is one of the top performing stocks on the JSE this year.
The rally is driven by surging global demand for gold as investors seek safety in the face of escalating trade tensions and a weakening US dollar.
With spot gold prices above $3,220/oz, South African miners like Harmony – already well leveraged to gold – are benefiting from expanding margins and positive sentiment.
This gold driven surge has taken the broader FTSE/JSE All Share Index up 7% year to date in dollar terms, outperforming benchmarks like the S&P 500 and MSCI Emerging Markets Index.
Quick Stats:
Gold forecast (2025): $3,220/oz
Expected ROIC for SA miners: ~15%
JSE All Share Index (USD): +7% YTD
Harmony Gold (HAR): +40% since March
HAR Technical Analysis: Is the Rally Overheating?
On the chart, HAR is in a strong uptrend, recently touched ZAR 36,182, a key Fibonacci resistance zone. While the price action is bullish, the RSI at 80.5 is overbought – so be cautious of near term consolidation or a pullback.

Key Technical Levels:
Immediate resistance: ZAR 36,182
Fibonacci support zones:
23.6%: ZAR 33,361
38.2%: ZAR 31,617
50%: ZAR 30,206
Trendline support: ~ZAR 28,800
RSI: 80.5 – overbought
Trade Setup: Watch the Dip for Reentry
For those looking to trade Harmony, chasing the highs is risky. A better approach may be to wait for a pullback to key support levels.
Buy Zone (on pullback): ZAR 30,200 – 31,600
Stop Loss: Below ZAR 28,800
Upside Targets: ZAR 36,000 → ZAR 38,572
Confirmation Signals:
RSI cools below 70
Daily close above ZAR 36,200 with volume
Conclusion
Harmony Gold’s 40% rise since March is a gold market macro play. As safe haven flows increase and gold prices keep going up, HAR is one of the top performers on the JSE this year. But with momentum indicators overbought, waiting for a dip may be the smarter way to get in this still bullish trade.
- Check out our free forex signals
- Follow the top economic events on FX Leaders economic calendar
- Trade better, discover more Forex Trading Strategies
- Open a FREE Trading Account
Related Articles

Comments
Sidebar rates
Related Posts
