DeFi Exodus Hits $12B—Ethereum (ETH) Slides to $1,567
Ethereum is down again, at $1,567 as bearishness sweeps the DeFi space. According to DeFiLlama, Ethereum-based protocols have...
Live ETH/USD Chart

Ethereum is down again, at $1,567 as bearishness sweeps the DeFi space. According to DeFiLlama, Ethereum-based protocols have lost over $12B in TVL since March – a big drop in user activity and capital from the former king of smart contracts.
To make matters worse, Ethereum is losing ground to faster, cheaper alternatives. Competing Layer-1 chains like Solana and Avalanche, and Layer-2 networks like Arbitrum and Base are pulling liquidity and users away. The ETH/BTC ratio is below 0.02, and investors are favoring Bitcoin in this market.
Ethereum’s DeFi dominance has dropped below 55%, a long way from the 70%+ it held in 2021.
Bearish Indicators at a Glance:
$12B outflows from DeFi on Ethereum since March
User growth and activity flat despite lower fees
Dencun Upgrade: Technical Win, Adoption Miss
The much-hyped Dencun upgrade in March 2025 lowered gas fees, but failed to get people excited. Daily transaction volumes and wallet activity are flat, so cheaper fees haven’t been enough to get users back on-chain.
Meanwhile, Ethereum’s own Layer-2s are soaking up most of the traffic. Optimism and Base are growing fast, and mainnet is seeing lower engagement than expected post-upgrade.
The regulatory environment hasn’t helped either. Even with the repeal of the DeFi KYC rule under President Trump, uncertainty continues to keep capital on the sidelines. And with NFTs moving to multichain ecosystems, Ethereum’s role as the central smart contract hub is under pressure.
Key On-Chain Challenges:
Fees are lower, but activity hasn’t rebounded
Mainnet is losing volume to Layer-2s
NFTs are multichain, reducing ETH reliance
Technical Setup: Will $1,416 hold?
ETH is below its 50-period EMA and trying to hold $1,545. RSI is 35, getting close to oversold but there’s still room to go lower. A break below $1,545 could go to $1,471 and then $1,416 which is a big psychological and technical floor.
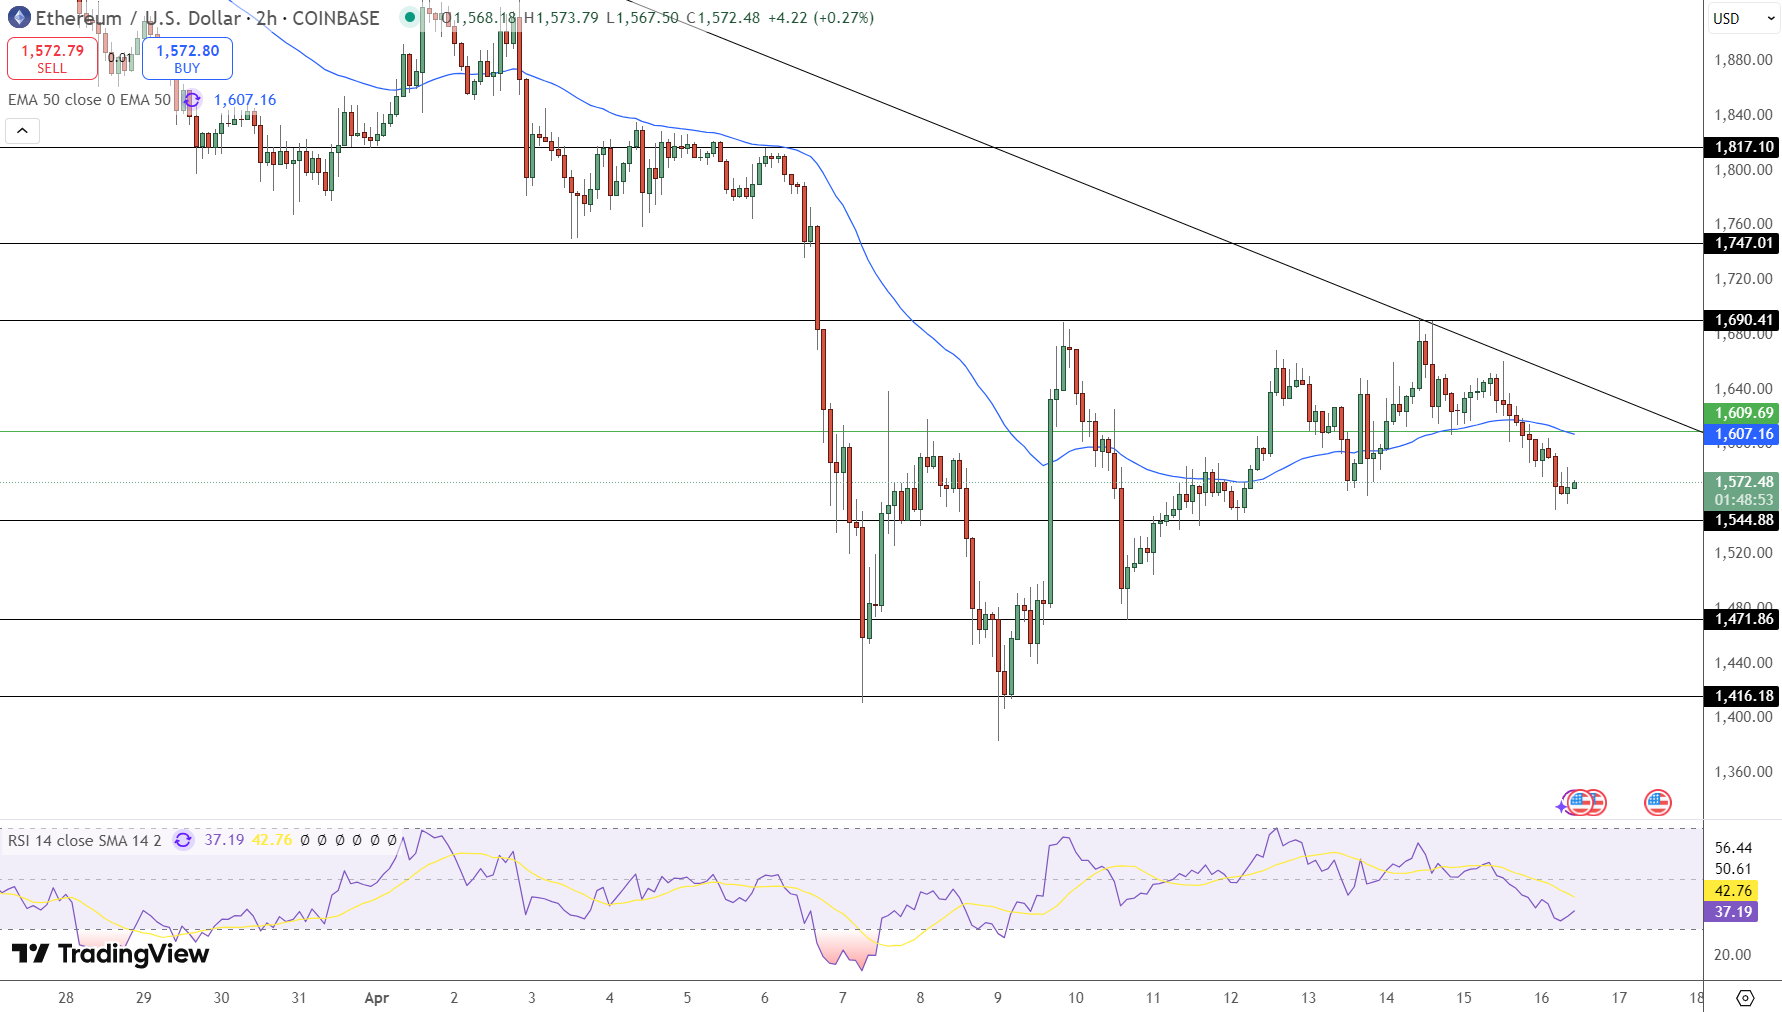
For bulls to take control, ETH needs to reclaim $1,606 and then break back above $1,690 – a big ask unless there’s a catalyst to change the narrative.
Levels to Watch:
Short Entry: Below $1,543
Downside Targets: $1,471 and $1,416
Stop Loss: $1,580
Bullish Reversal Level: Above $1,690
Ethereum’s short-term is looking shaky. Between outflows, illiquidity and competition from L1 and L2 chains, ETH is up against it. Without a catalyst or change in market structure, a deeper correction to $1,416 looks more likely.
For now, the bulls are on the back foot – and the bears are in control.
- Check out our free forex signals
- Follow the top economic events on FX Leaders economic calendar
- Trade better, discover more Forex Trading Strategies
- Open a FREE Trading Account
Related Articles
Comments
Sidebar rates
Related Posts
