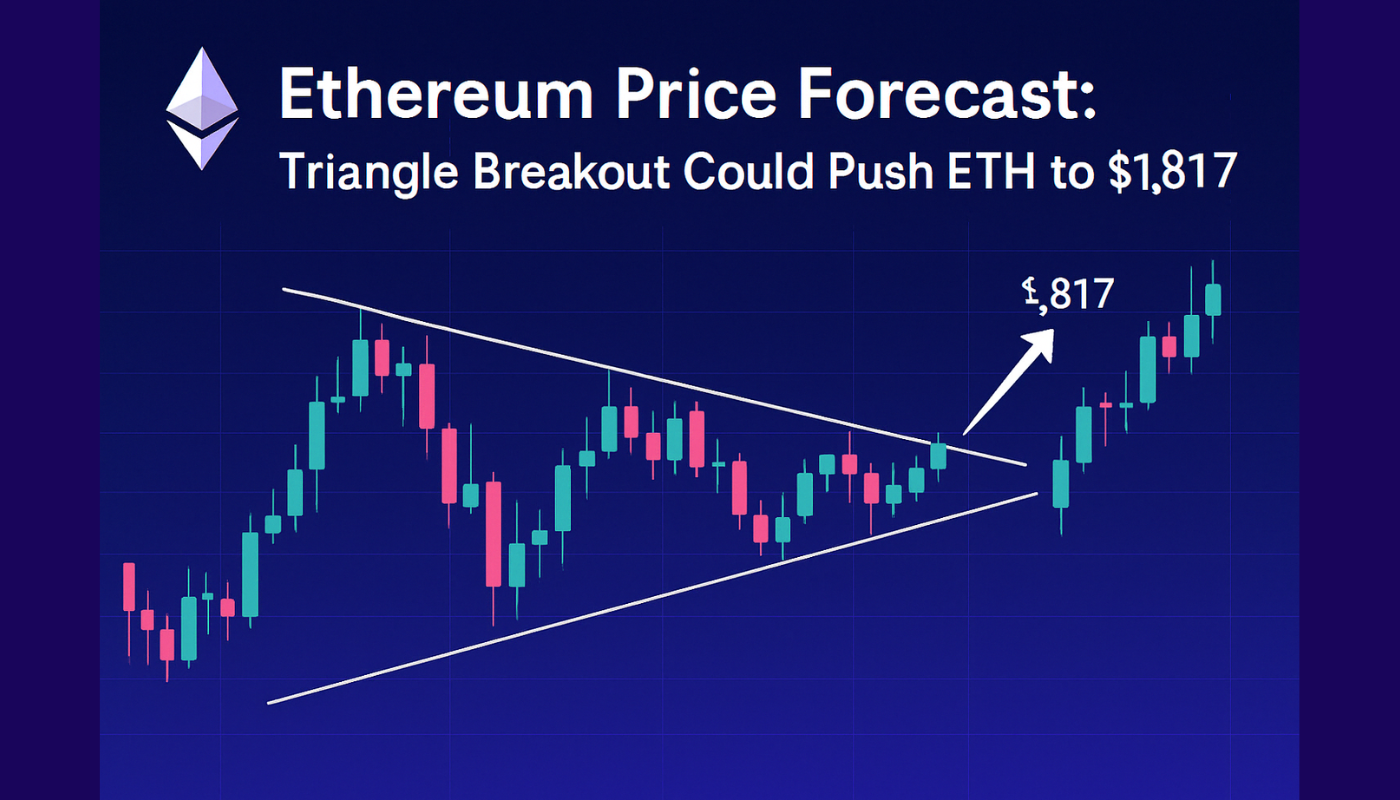
Ethereum Price Forecast: Triangle Breakout Could Send ETH to $1,817
After a rough start to 2025—its worst Q1 in 5 years—Ethereum (ETH) is showing some life. ETH just bounced off $1,400 and is now trading at $1,645.
A 3% weekly gain has traders waiting for a breakout. Global macro uncertainty and crypto ETF outflows have been weighing on sentiment but new technicals are hinting at a trend reversal.
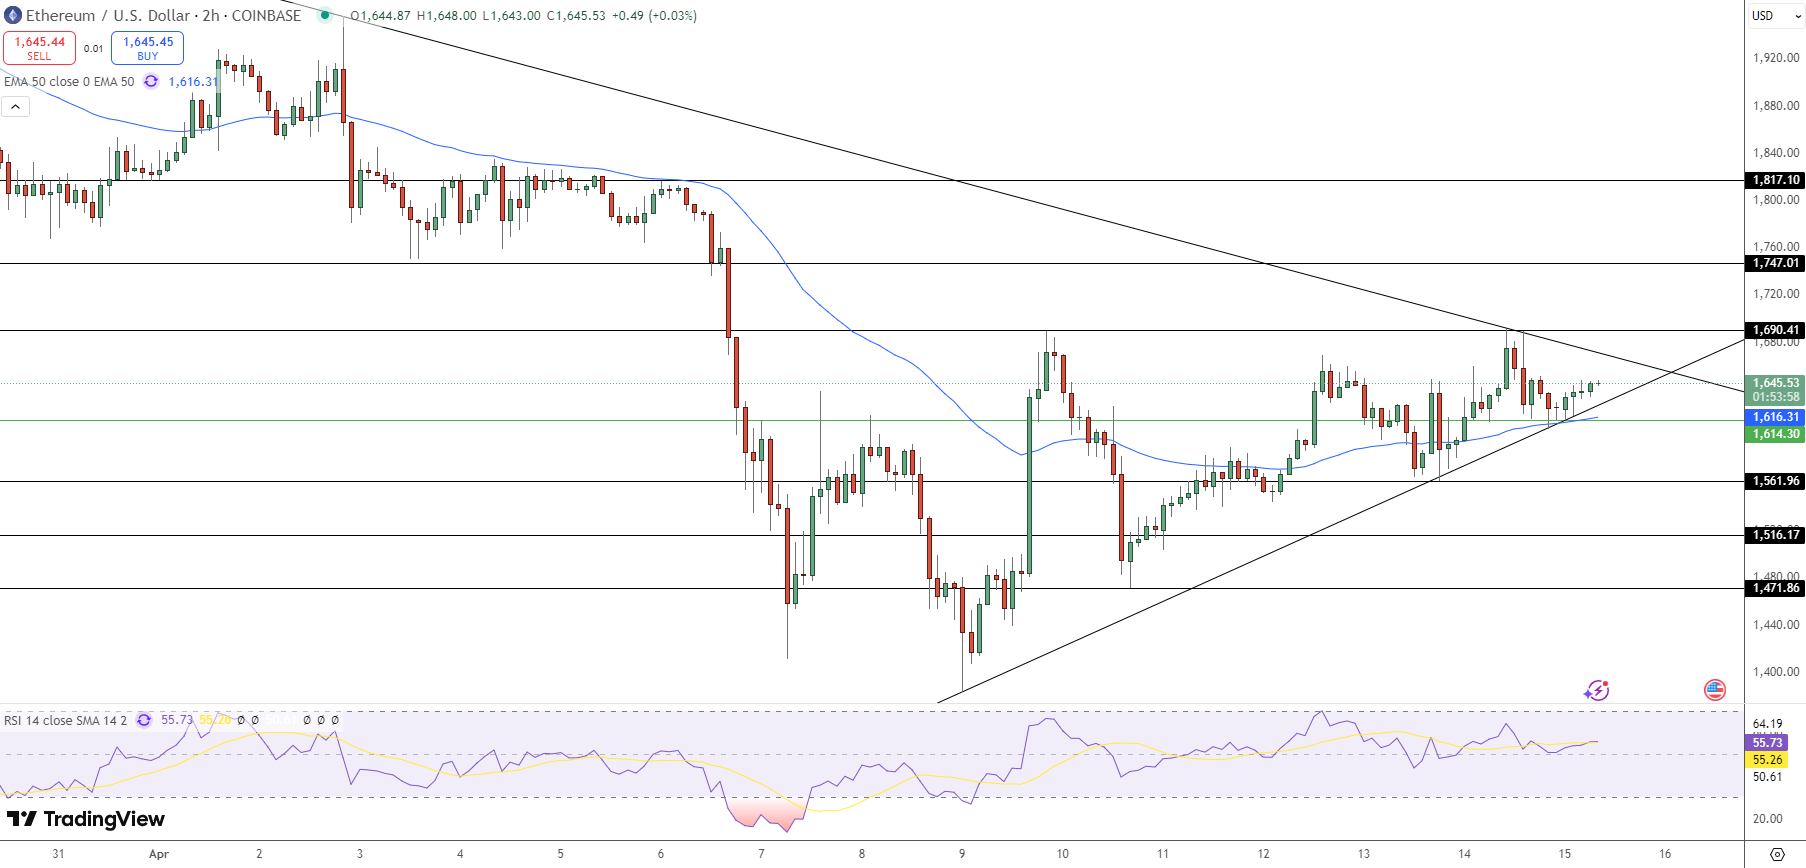
A symmetrical triangle has formed on the 2-hour chart which means a big move is coming. If ETH can close above $1,690 the next leg up could take it to $1,747 or $1,817—a key resistance zone before $1,900 comes into play.
TD Sequential Indicator Flashes Bullish Reversal
One of the best signs comes from the TD Sequential indicator—a favorite among experienced traders. It just flashed a “9” on the weekly chart—a setup that often precedes trend reversals. Crypto analyst Ali Martinez pointed this out as a strong buy signal especially since downside momentum has lost steam.
Adding to the bullish case, ETH’s RSI is above 55 and not overbought. Candlestick patterns are also showing decreasing selling pressure which often precedes breakouts.
Meanwhile a big player just opened a $12.6M long position on ETH. Institutional conviction is high for a short term rally.
ETH Trade Setup and What to Watch
If ETH can hold above the trendline and 50-EMA at $1,616 the odds of an upside breakout improve. Traders are watching for a clean close above $1,690.
Trade Setup:
Entry: Buy above $1,692 after breakout confirmation
Target: $1,747 – $1,817
Stop Loss: $1,610
Key Takeaways:
ETH is forming a symmetrical triangle
TD Sequential “9” adds to the bullish case
RSI near 55.7 supports the momentum
A whale’s $12.6M long shows institutional conviction
Conclusion: ETH is back. $1,900 is a long shot for now but a clean above $1,690 and we’re at $1,817. Be quick, wait for volume and manage risk.

Sidebar rates
Related Posts
