XRP Forecast: Wave Theory Predicts $20 Surge—But Could It Drop First?
XRP is setting up for a massive breakout—but not before one final dip, according to XForced Global, who uses Elliott Wave theory to chart...
XRP is setting up for a massive breakout—but not before one final dip, according to XForced Global, who uses Elliott Wave theory to chart price movements.

Here’s the logic: XRP’s previous run from $0.50 to $3.40 was Wave 1, the start of a bigger bull cycle. We’re now in Wave 2, a corrective phase where prices retrace before the next leg up. According to this view, XRP could dip to a “buy zone” between $1.00 and $1.70 before launching into Wave 3—which if history rhymes could take it all the way to $20.
If XRP gets to $20 it won’t just break new highs. It will blow up its market cap to an estimated $1.16 trillion and potentially become the second largest crypto asset after Bitcoin—overtaking Ethereum.
Short-Term Outlook: Can XRP get to $2.60?
While the long-term vision is big, traders are watching the short-term chart closely.
XRP is consolidating around $2.06 having already broken past key resistance zones at $1.85 and $1.95. The next big test? $2.11. That’s the floor of a 4 month trading range that goes up to $2.60—a range with heavy volume and resistance.
If bulls can break above $2.11 with volume XRP could go to $2.41 and then retest $2.60—a big bullish move.
What’s Fueling the Bullish Sentiment?
Several things are driving the optimism:
Trump’s 90 day tariff pause has eased macroeconomic tensions and is good for risk assets like crypto.
Ripple’s win against the SEC has removed a major overhang on XRP’s future.
Ripple’s acquisition of Hidden Road, a prime brokerage platform, is a sign of deeper institutional growth.
These are the perfect storm for a potential bullish continuation in the coming weeks.
XRP/USD 4H Chart – Technical Analysis (April 12)
XRP is breaking out of a symmetrical triangle on the 4H chart and is trading at $2.06. The move above the triangle resistance and the 50-EMA ($1.99) is bullish.
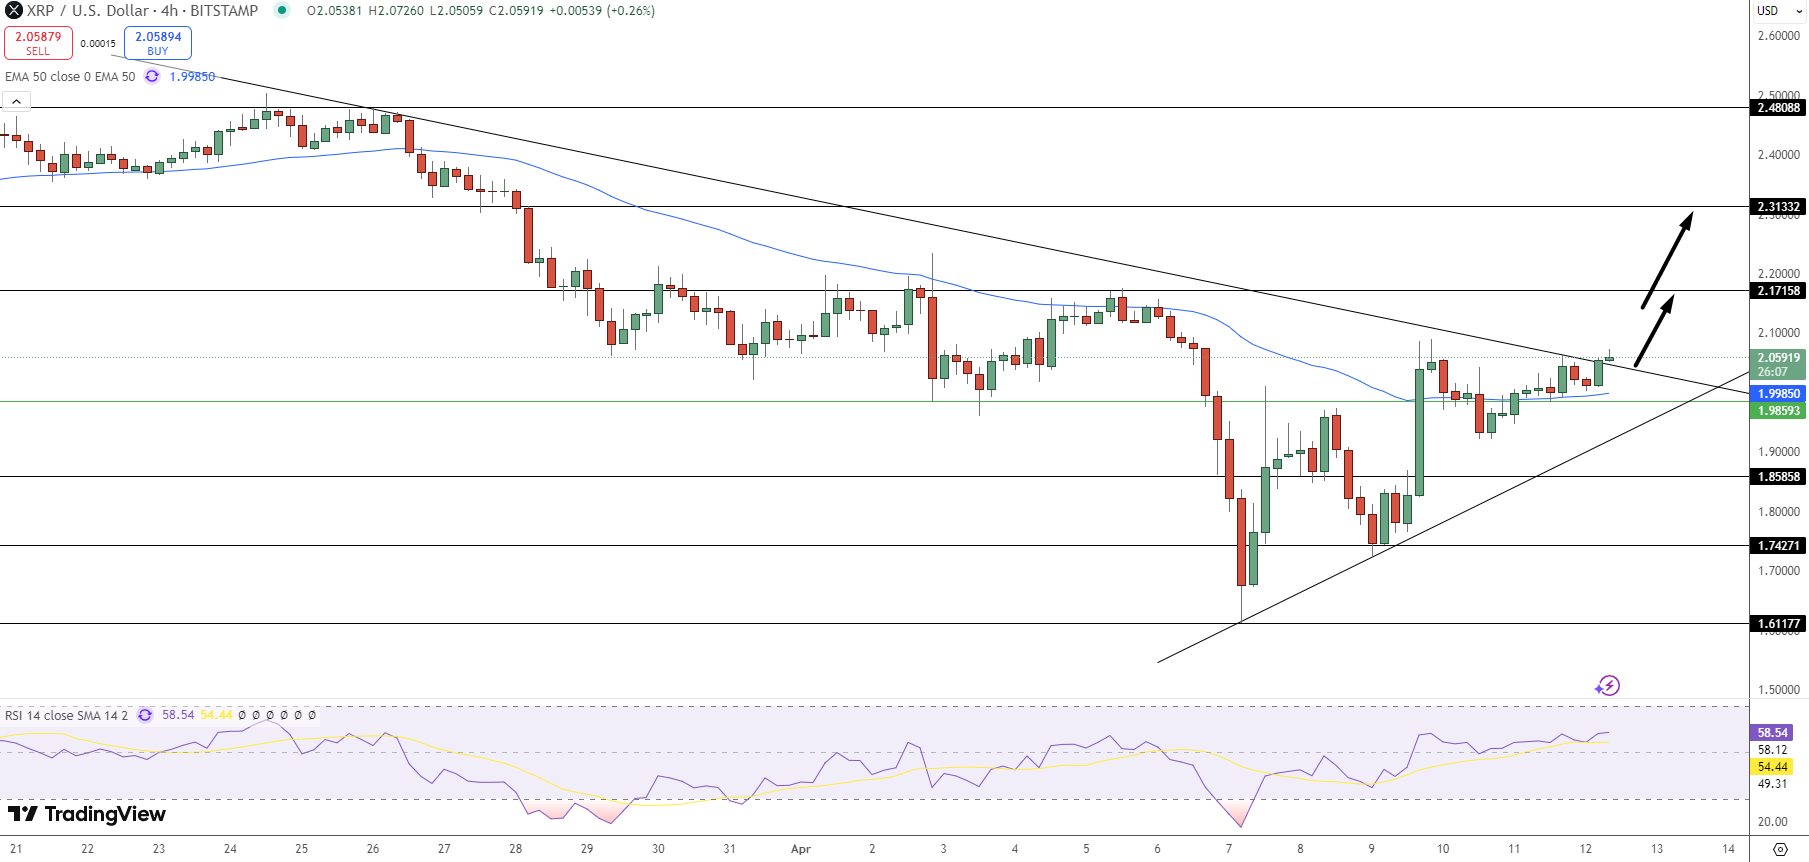
RSI is 58.87 and climbing but not yet overbought.
A close above $2.17 could take it to $2.31-$2.48.
Key support levels: $1.99 (short term) and $1.86 (stronger demand).
As long as XRP is above $1.99 the short term trend is bullish going into the weekend.
Final Thoughts: Dip Before the Moon?
The $20 target is getting a lot of attention—but traders should be careful. A drop below $1.70 could still happen before the next big rally.
For now all eyes are on the $2.11 breakout zone. If that gives XRP could go to $2.60 and beyond faster than expected.
- Check out our free forex signals
- Follow the top economic events on FX Leaders economic calendar
- Trade better, discover more Forex Trading Strategies
- Open a FREE Trading Account
Related Articles
Comments
Sidebar rates
Related Posts
