Intel Corporation (INTC) Surges 21% in Just 24 Hours — What’s Behind the Explosive Rally?
Konstantin Kaiser•Thursday, April 10, 2025•3 min read

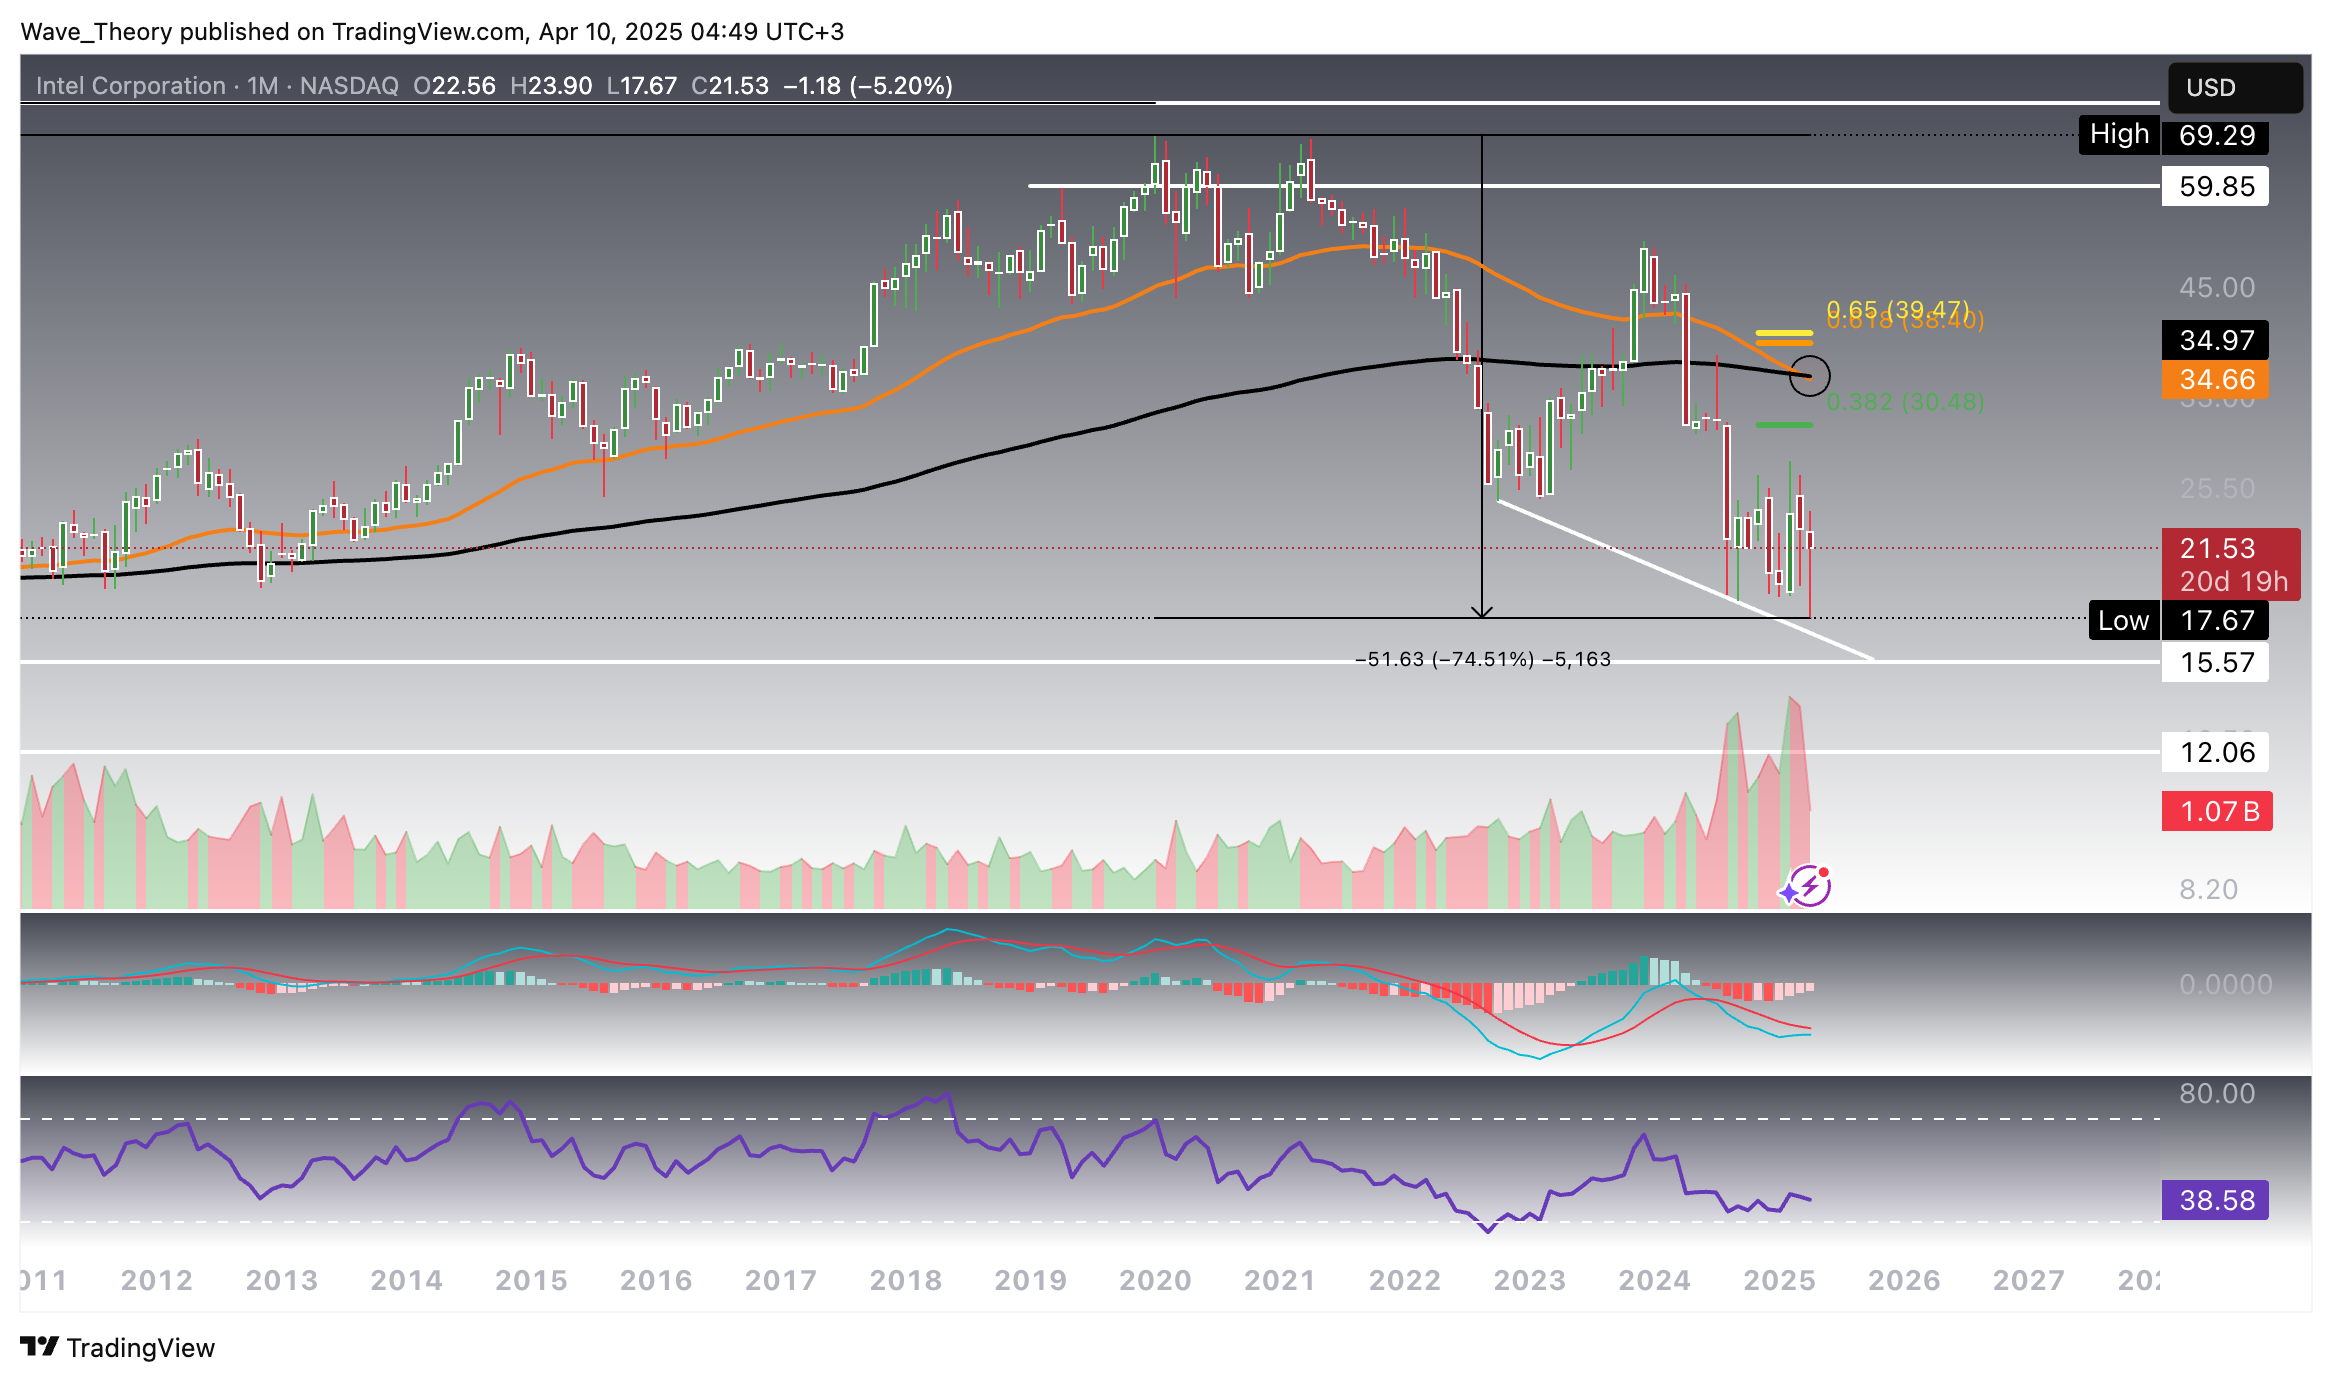
Intel (INTC) has been locked in a persistent downtrend for the past five years, steadily losing ground against its semiconductor peers. With prices approaching long-term support levels, the key question now is: Will the downtrend continue, or is a bullish rebound finally on the horizon?
Intel Down 74.5% Over 5 Years — Key Support Zone Approaches
Intel (INTC) has declined by an astonishing 74.5% over the past five years, continuing its long-term downtrend with no confirmed structural reversal to date. However, the stock is now approaching a significant multi-year support zone between $12 and $15.60, a level that may attract renewed buying interest.
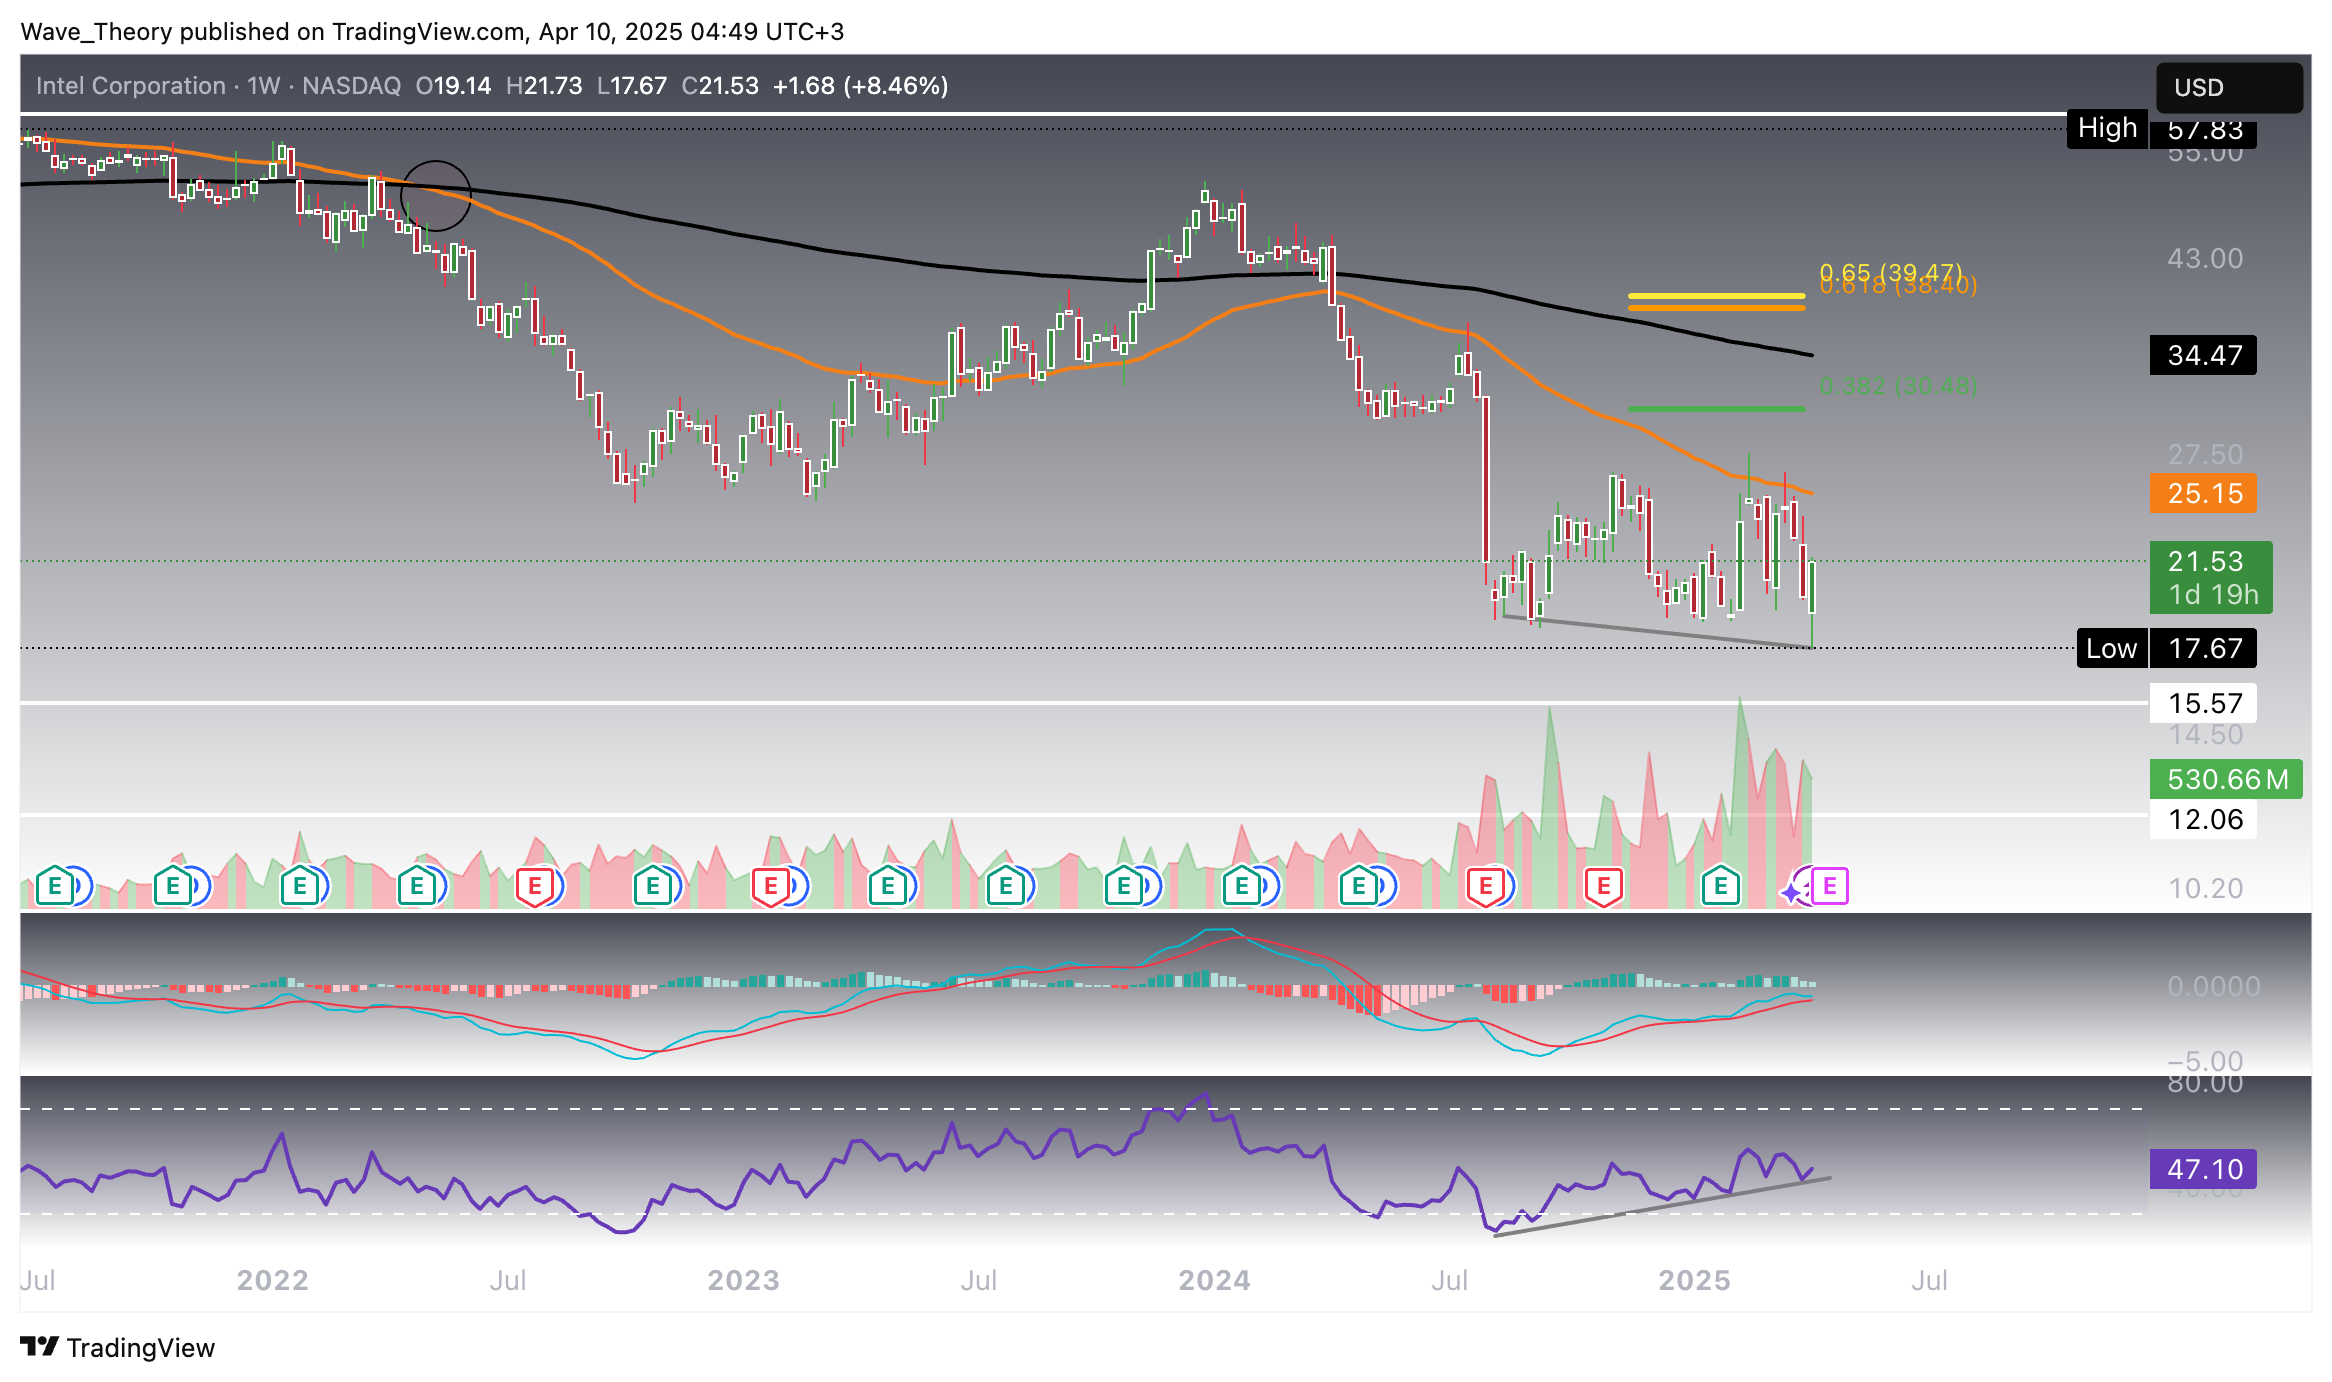
Notably, there are early signs of a potential bullish reversal emerging from key momentum indicators. The Relative Strength Index (RSI) is forming a bullish divergence, suggesting weakening downside momentum and increasing probability of a reversal. Additionally, the MACD histogram has been printing higher lows for four consecutive months, with the MACD lines nearing a bullish crossover — a development that would further strengthen the short- to medium-term bullish outlook.
That said, structural risks remain. The Exponential Moving Averages (EMAs) are on the verge of forming a death cross, which would reinforce the prevailing long-term bearish trend. Until that crossover is invalidated or price action confirms a sustained breakout above key resistance levels, Intel’s broader trend remains under pressure.
In summary, while Intel shows short- to medium-term upside potential, the long-term trend remains decisively bearish unless technical confirmation of a reversal emerges in the coming weeks.
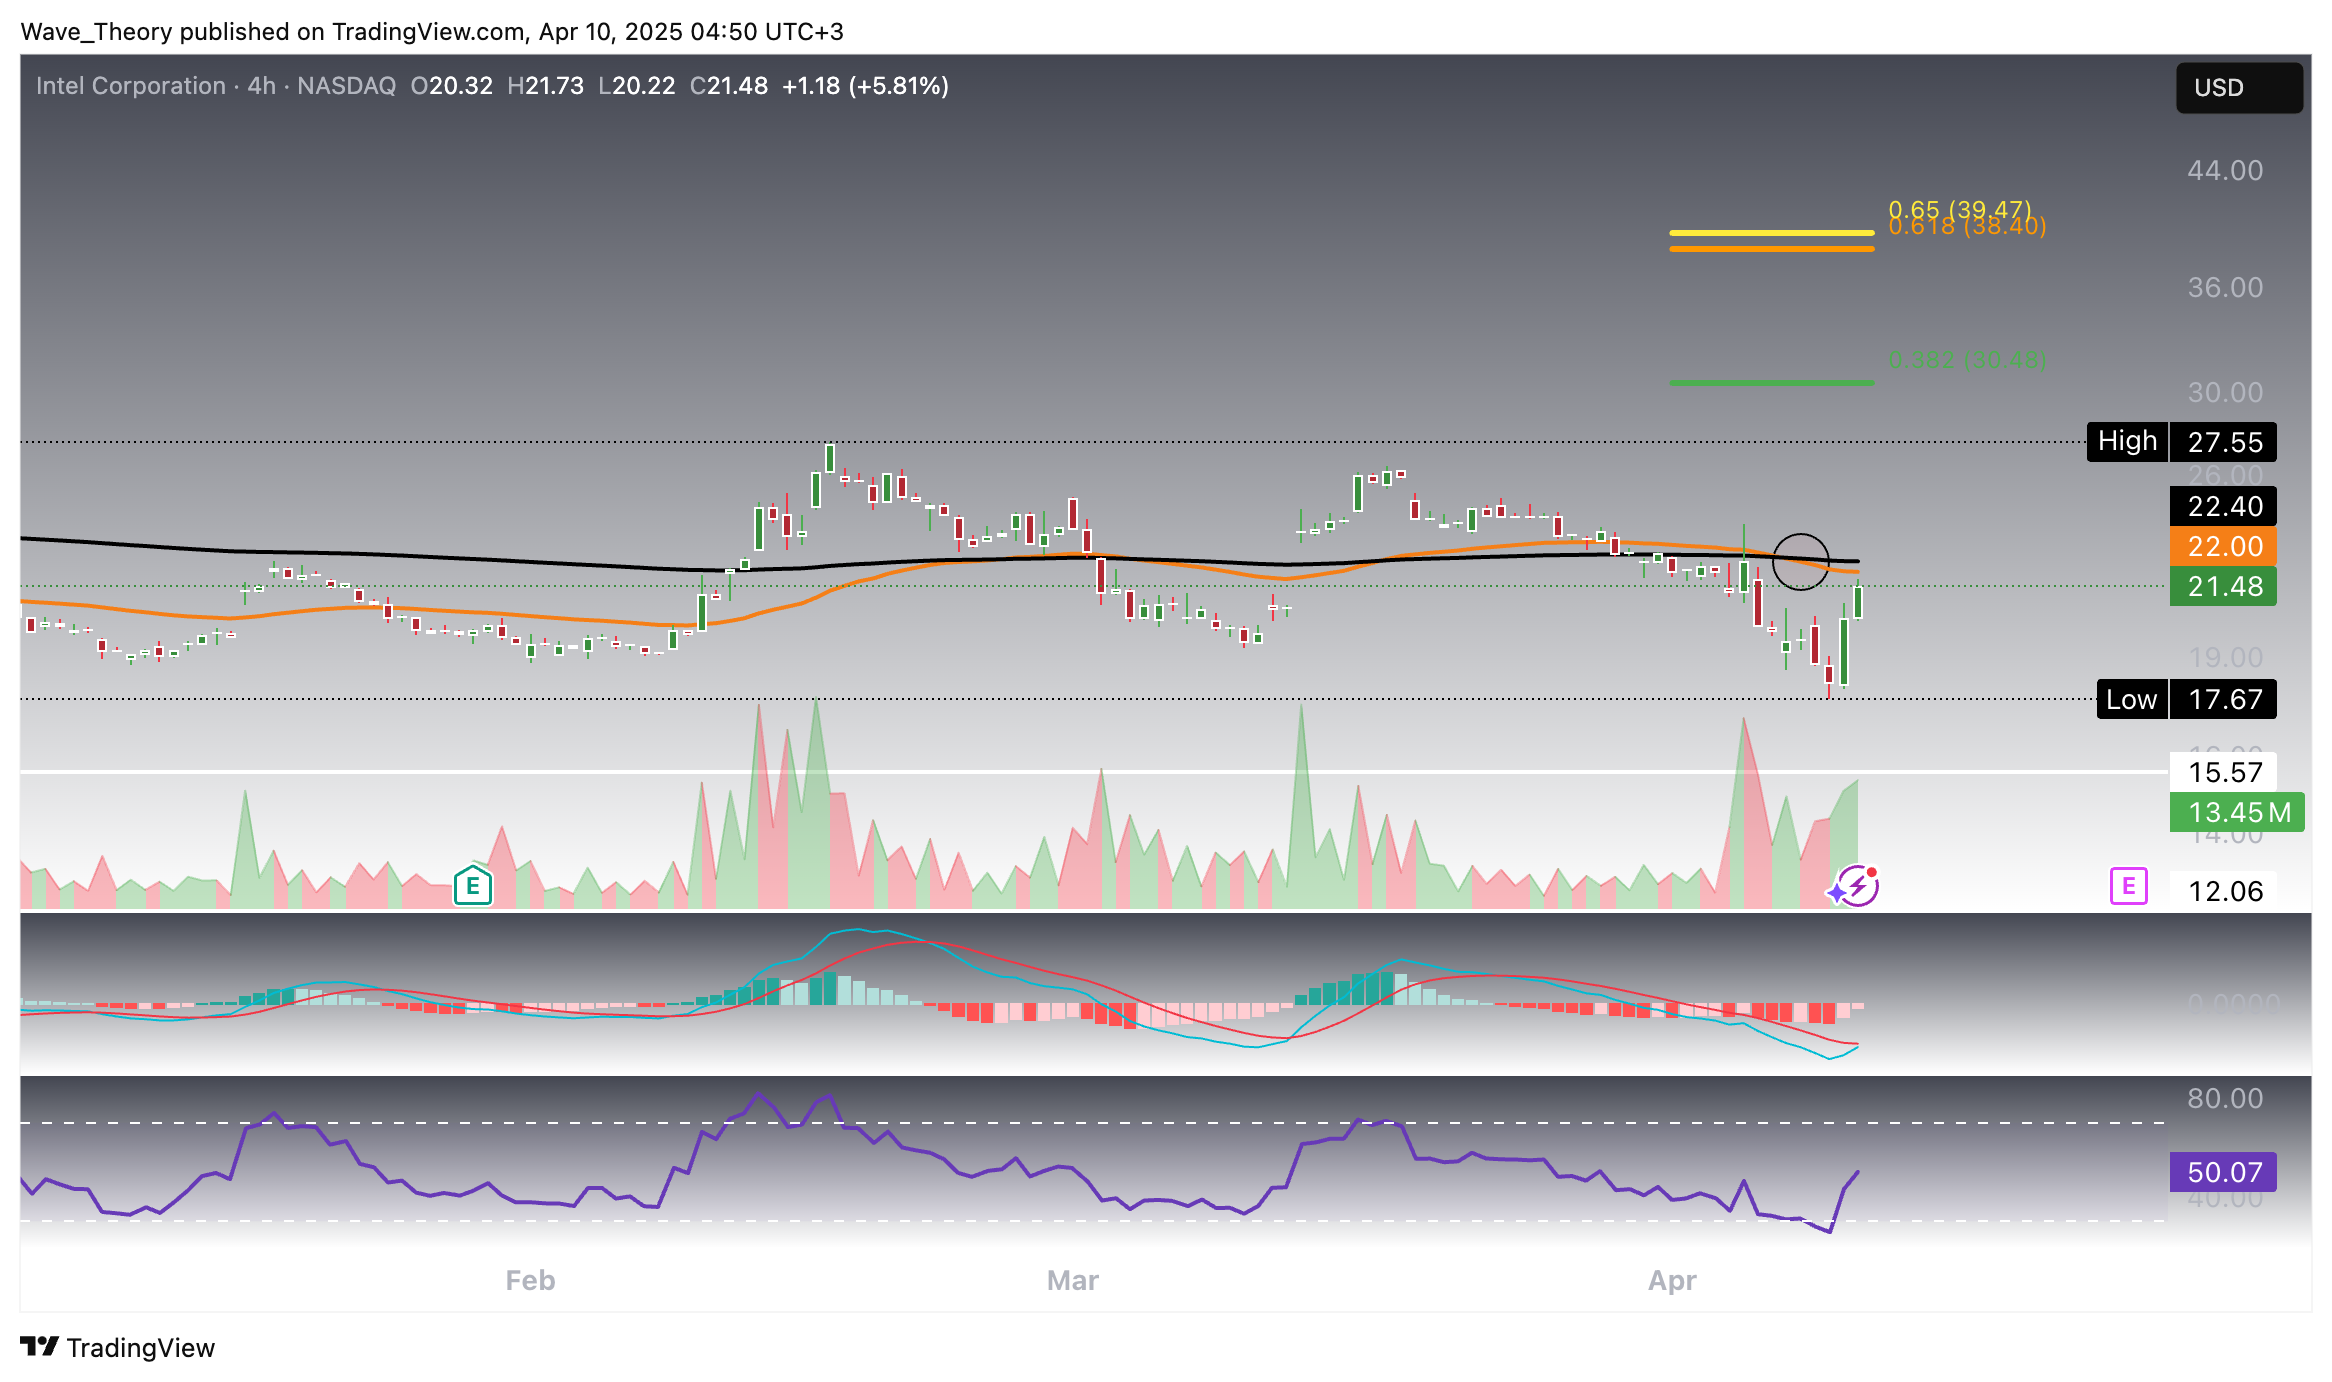
Death Cross Emerges on the 4H Chart — Mixed Signals for Intel
On the 4-hour chart, a death cross has now formed between the EMAs, reinforcing a short-term bearish trend confirmation. This crossover signals continued downside risk unless invalidated by a strong reversal.
That said, there are early signs of potential bullish divergence emerging. The MACD lines are on the verge of a bullish crossover, and the MACD histogram is currently ticking higher, suggesting short-term momentum may be shifting to the upside.
Meanwhile, the RSI remains in neutral territory, providing no strong directional bias at this stage. Overall, the technical picture is mixed—with bearish structure prevailing, but a possible short-term rebound in development.
- Check out our free forex signals
- Follow the top economic events on FX Leaders economic calendar
- Trade better, discover more Forex Trading Strategies
- Open a FREE Trading Account
ABOUT THE AUTHOR
See More
Konstantin Kaiser
Financial Writer and Market Analyst
Konstantin Kaiser comes from a data science background and has significant experience in quantitative trading. His interest in technology took a notable turn in 2013 when he discovered Bitcoin and was instantly intrigued by the potential of this disruptive technology.
Related Articles


Comments
Subscribe
Login
Please login to comment
0 Comments
Oldest
Sidebar rates
Related Posts
