AMD Rebounds Sharply at Fibonacci Support — A Perfect Entry Opportunity?

AMD has been in a steady correction for the past 14 months, but it has now reached a critical Fibonacci golden ratio support level. The price action is showing signs of a strong bullish bounce — could this mark the beginning of a reversal? Are bullish weeks ahead for AMD?
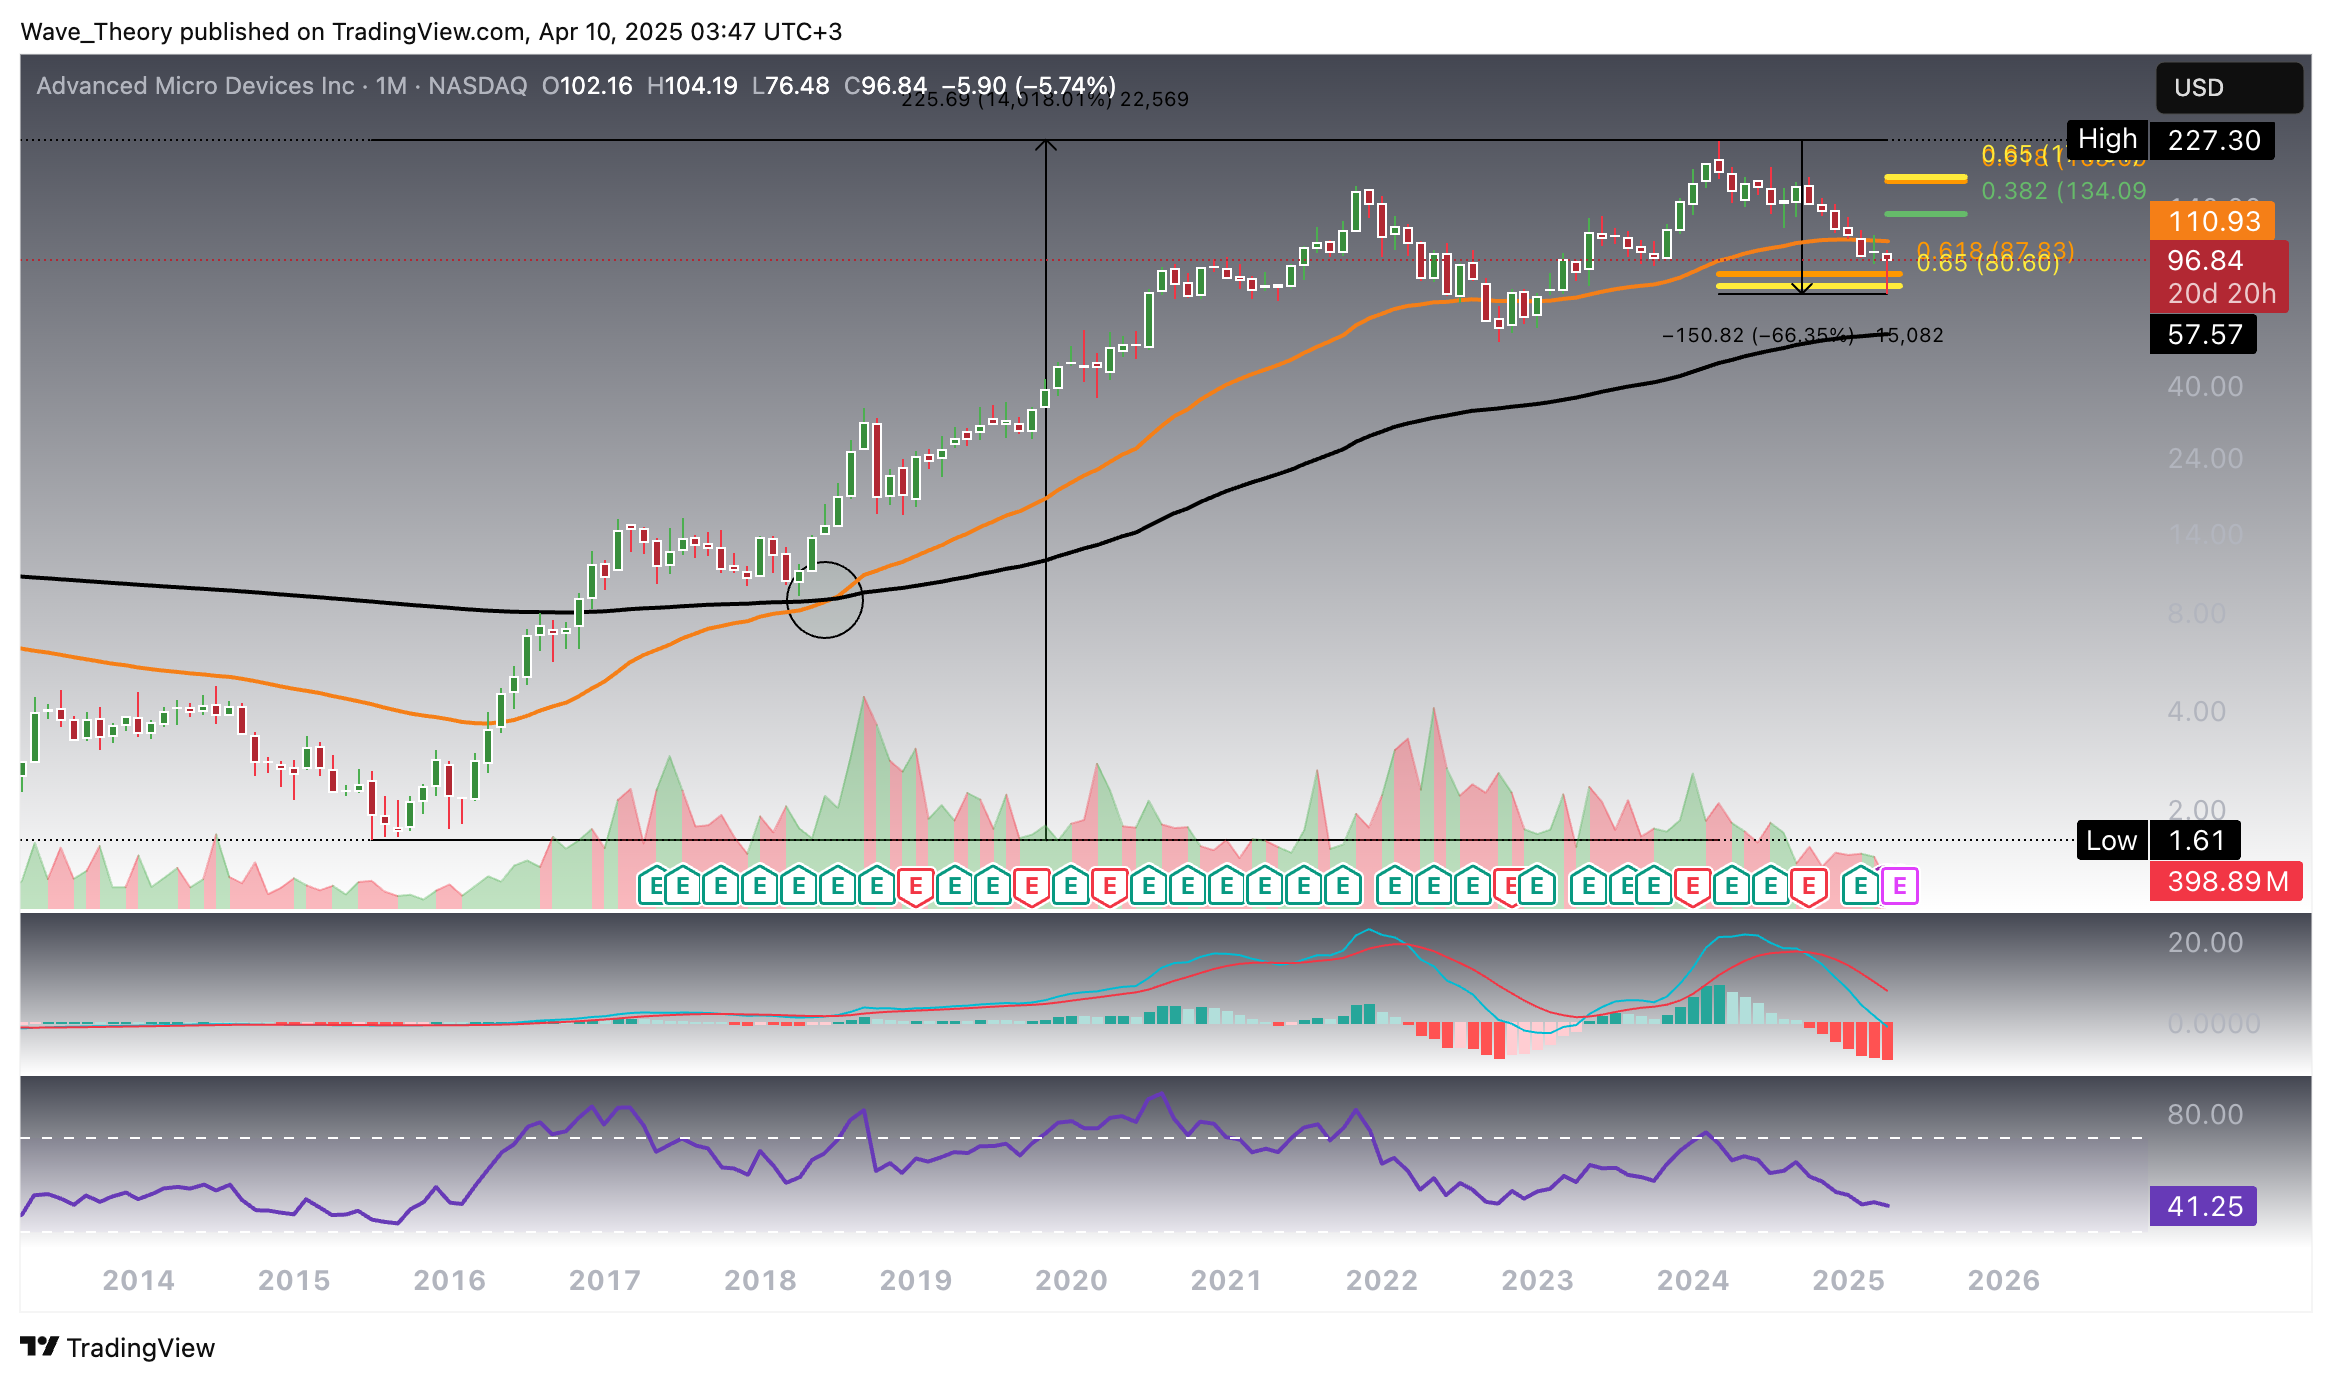
AMD Tests Golden Ratio Support After Breaking 50-Month EMA
AMD has recently broken below the key 50-month EMA support at $111, a significant long-term trend level that had previously acted as a strong base during prior corrections. Following the breakdown, the stock has now reached critical Fibonacci golden ratio support at $80, a historically significant retracement level. At this juncture, price action is exhibiting bullish behavior, suggesting the potential for a sustained upside move if the level holds.
Despite the encouraging bounce, the technical indicators remain mixed. On the monthly chart, the Exponential Moving Averages (EMAs) maintain a golden crossover, a structurally bullish signal that reflects strength in the broader trend. However, this is contrasted by a bearish MACD configuration:
The MACD lines have crossed to the downside,
and the MACD histogram is trending sharply lower, reinforcing ongoing bearish momentum beneath the surface.
Meanwhile, the Relative Strength Index (RSI) remains neutral, offering no clear bullish or bearish divergence, which underscores the current indecision in market sentiment.
In summary, while AMD’s bounce off the golden ratio could signal a technical bottom, confirmation will depend on follow-through price action and a shift in momentum indicators. A sustained reclaim of key EMAs, along with improving MACD dynamics, would strengthen the bullish case moving forward.
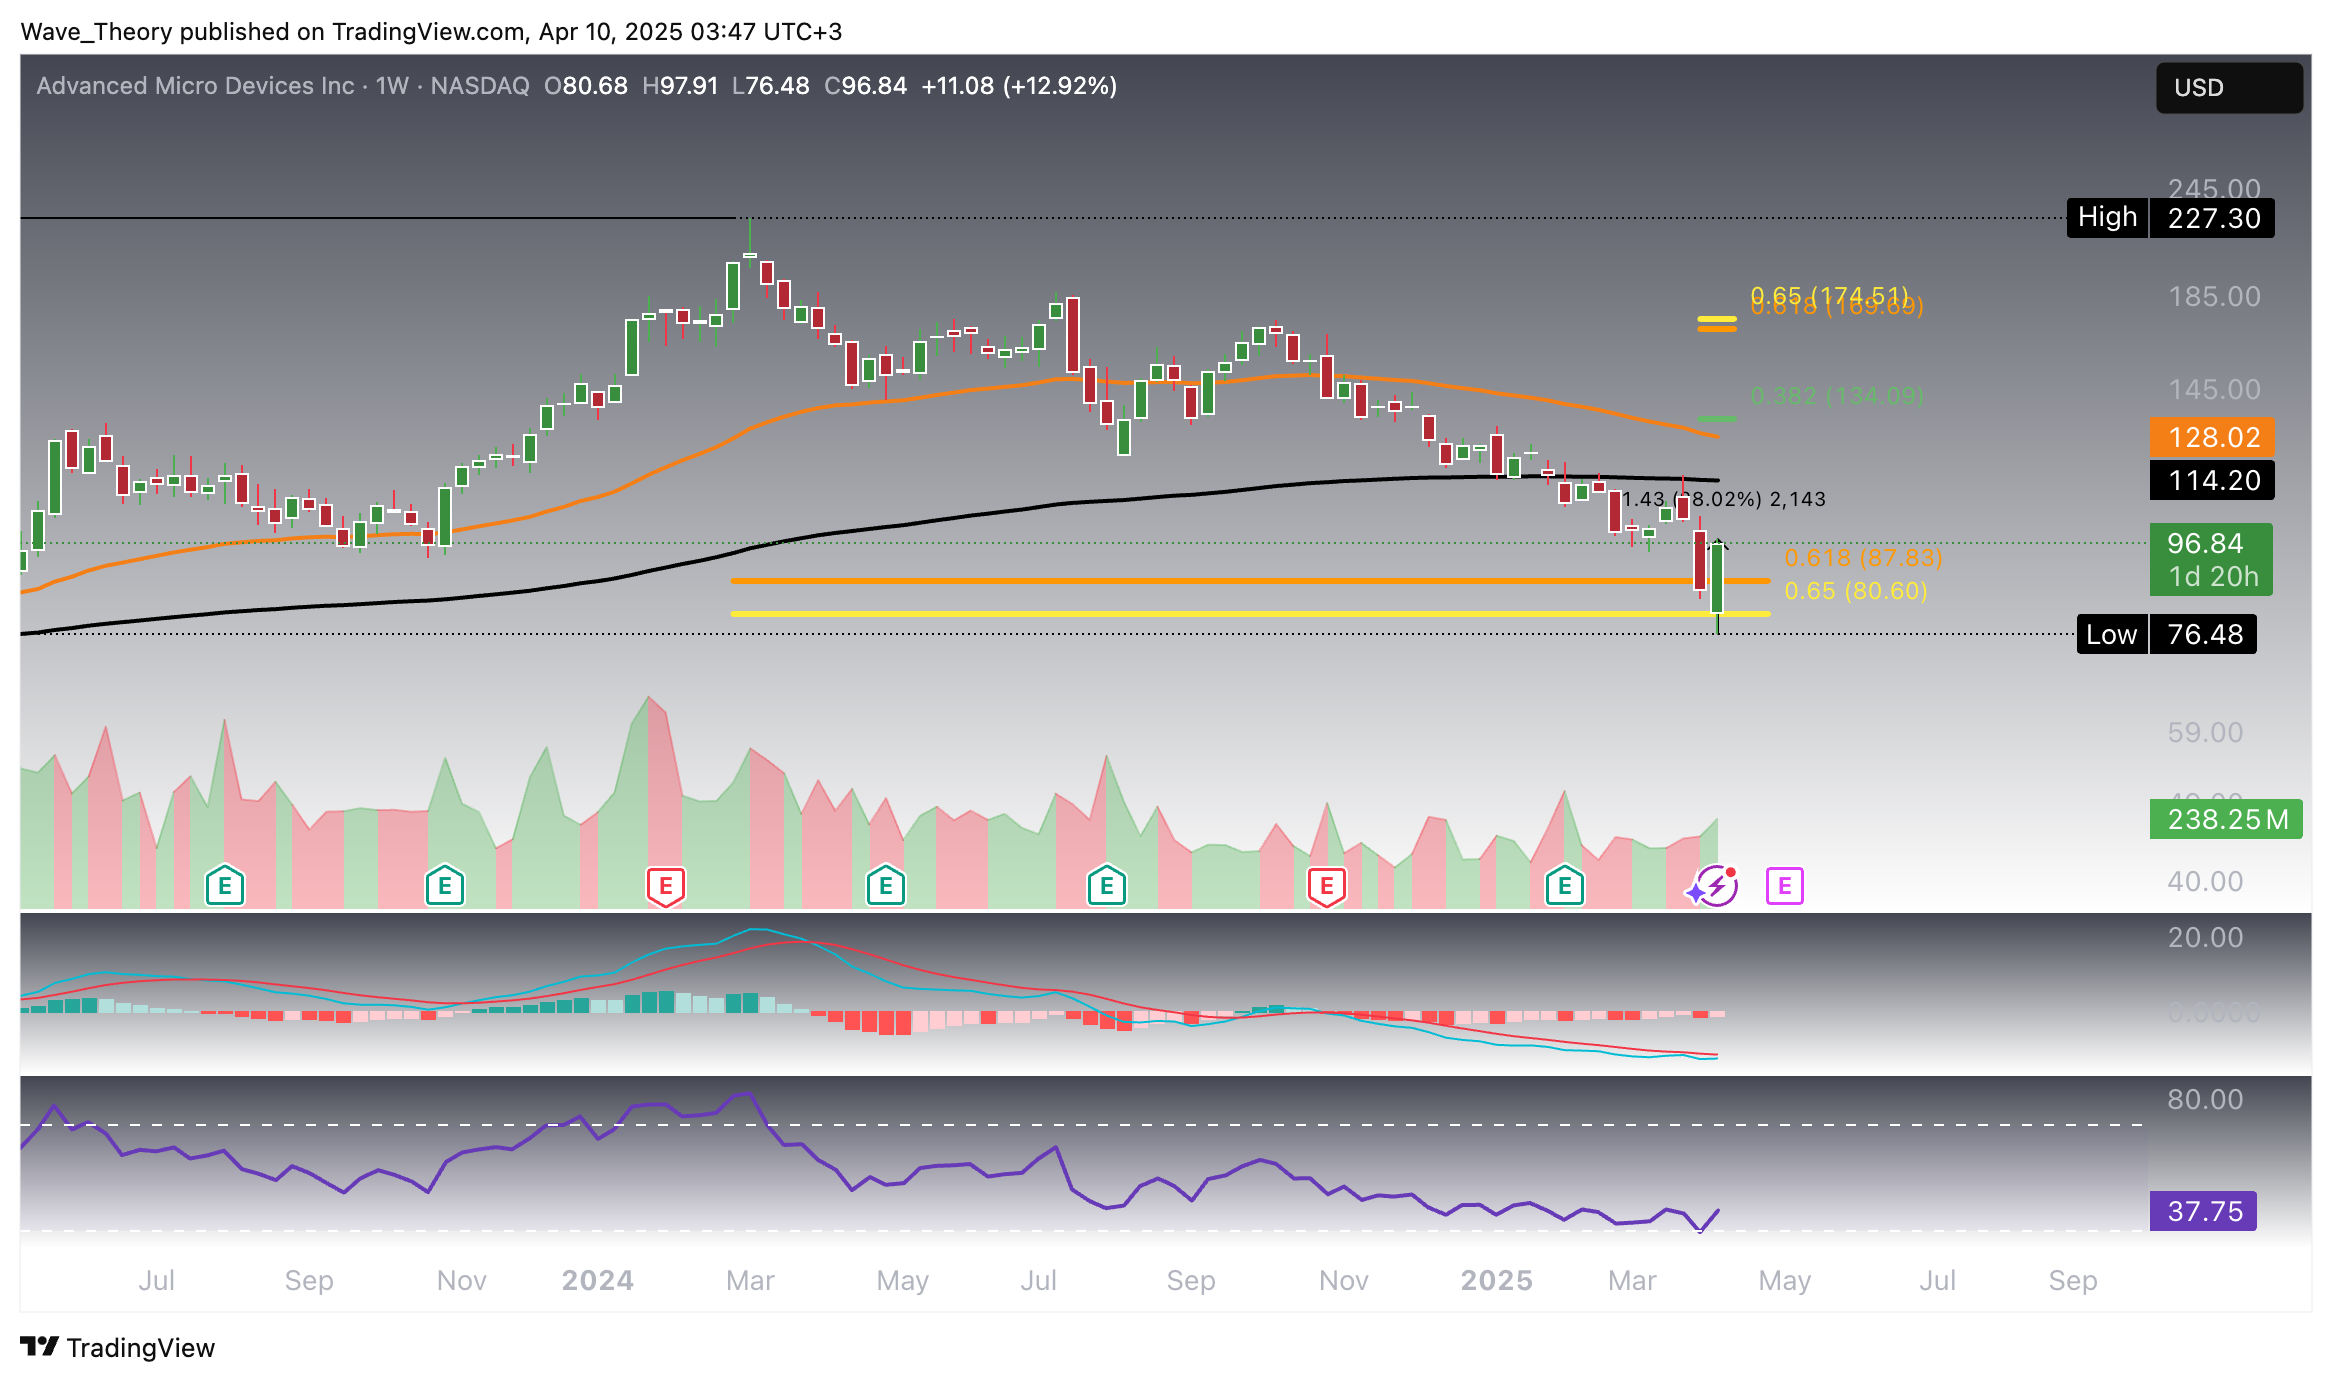
AMD Rebounds 8% Off Key Support — Eyes Set on Fib Resistance at $134 and $174
Since reaching the critical Fibonacci golden ratio support around $80 earlier this week, AMD has already rebounded by 8%, signaling renewed bullish interest at this historically significant level. Should this upward momentum continue, the stock could target the next major Fibonacci resistance levels at $134 and $174, respectively.
Importantly, only a decisive break above the golden ratio at $174 would invalidate the current correction phase and confirm a full resumption of AMD’s long-term uptrend.
From a momentum standpoint, the MACD histogram has begun ticking higher, offering early signs of bullish momentum building underneath the surface. However, the MACD lines remain in a bearish crossover, suggesting that caution is still warranted until further confirmation appears. The RSI continues to trend in neutral territory, offering no extreme overbought or oversold signals at this time.
Despite recent weakness, the EMAs continue to display a golden crossover on the weekly chart, reinforcing a mid-term bullish structure. A strong continuation above key resistance levels would further validate the bullish reversal thesis.
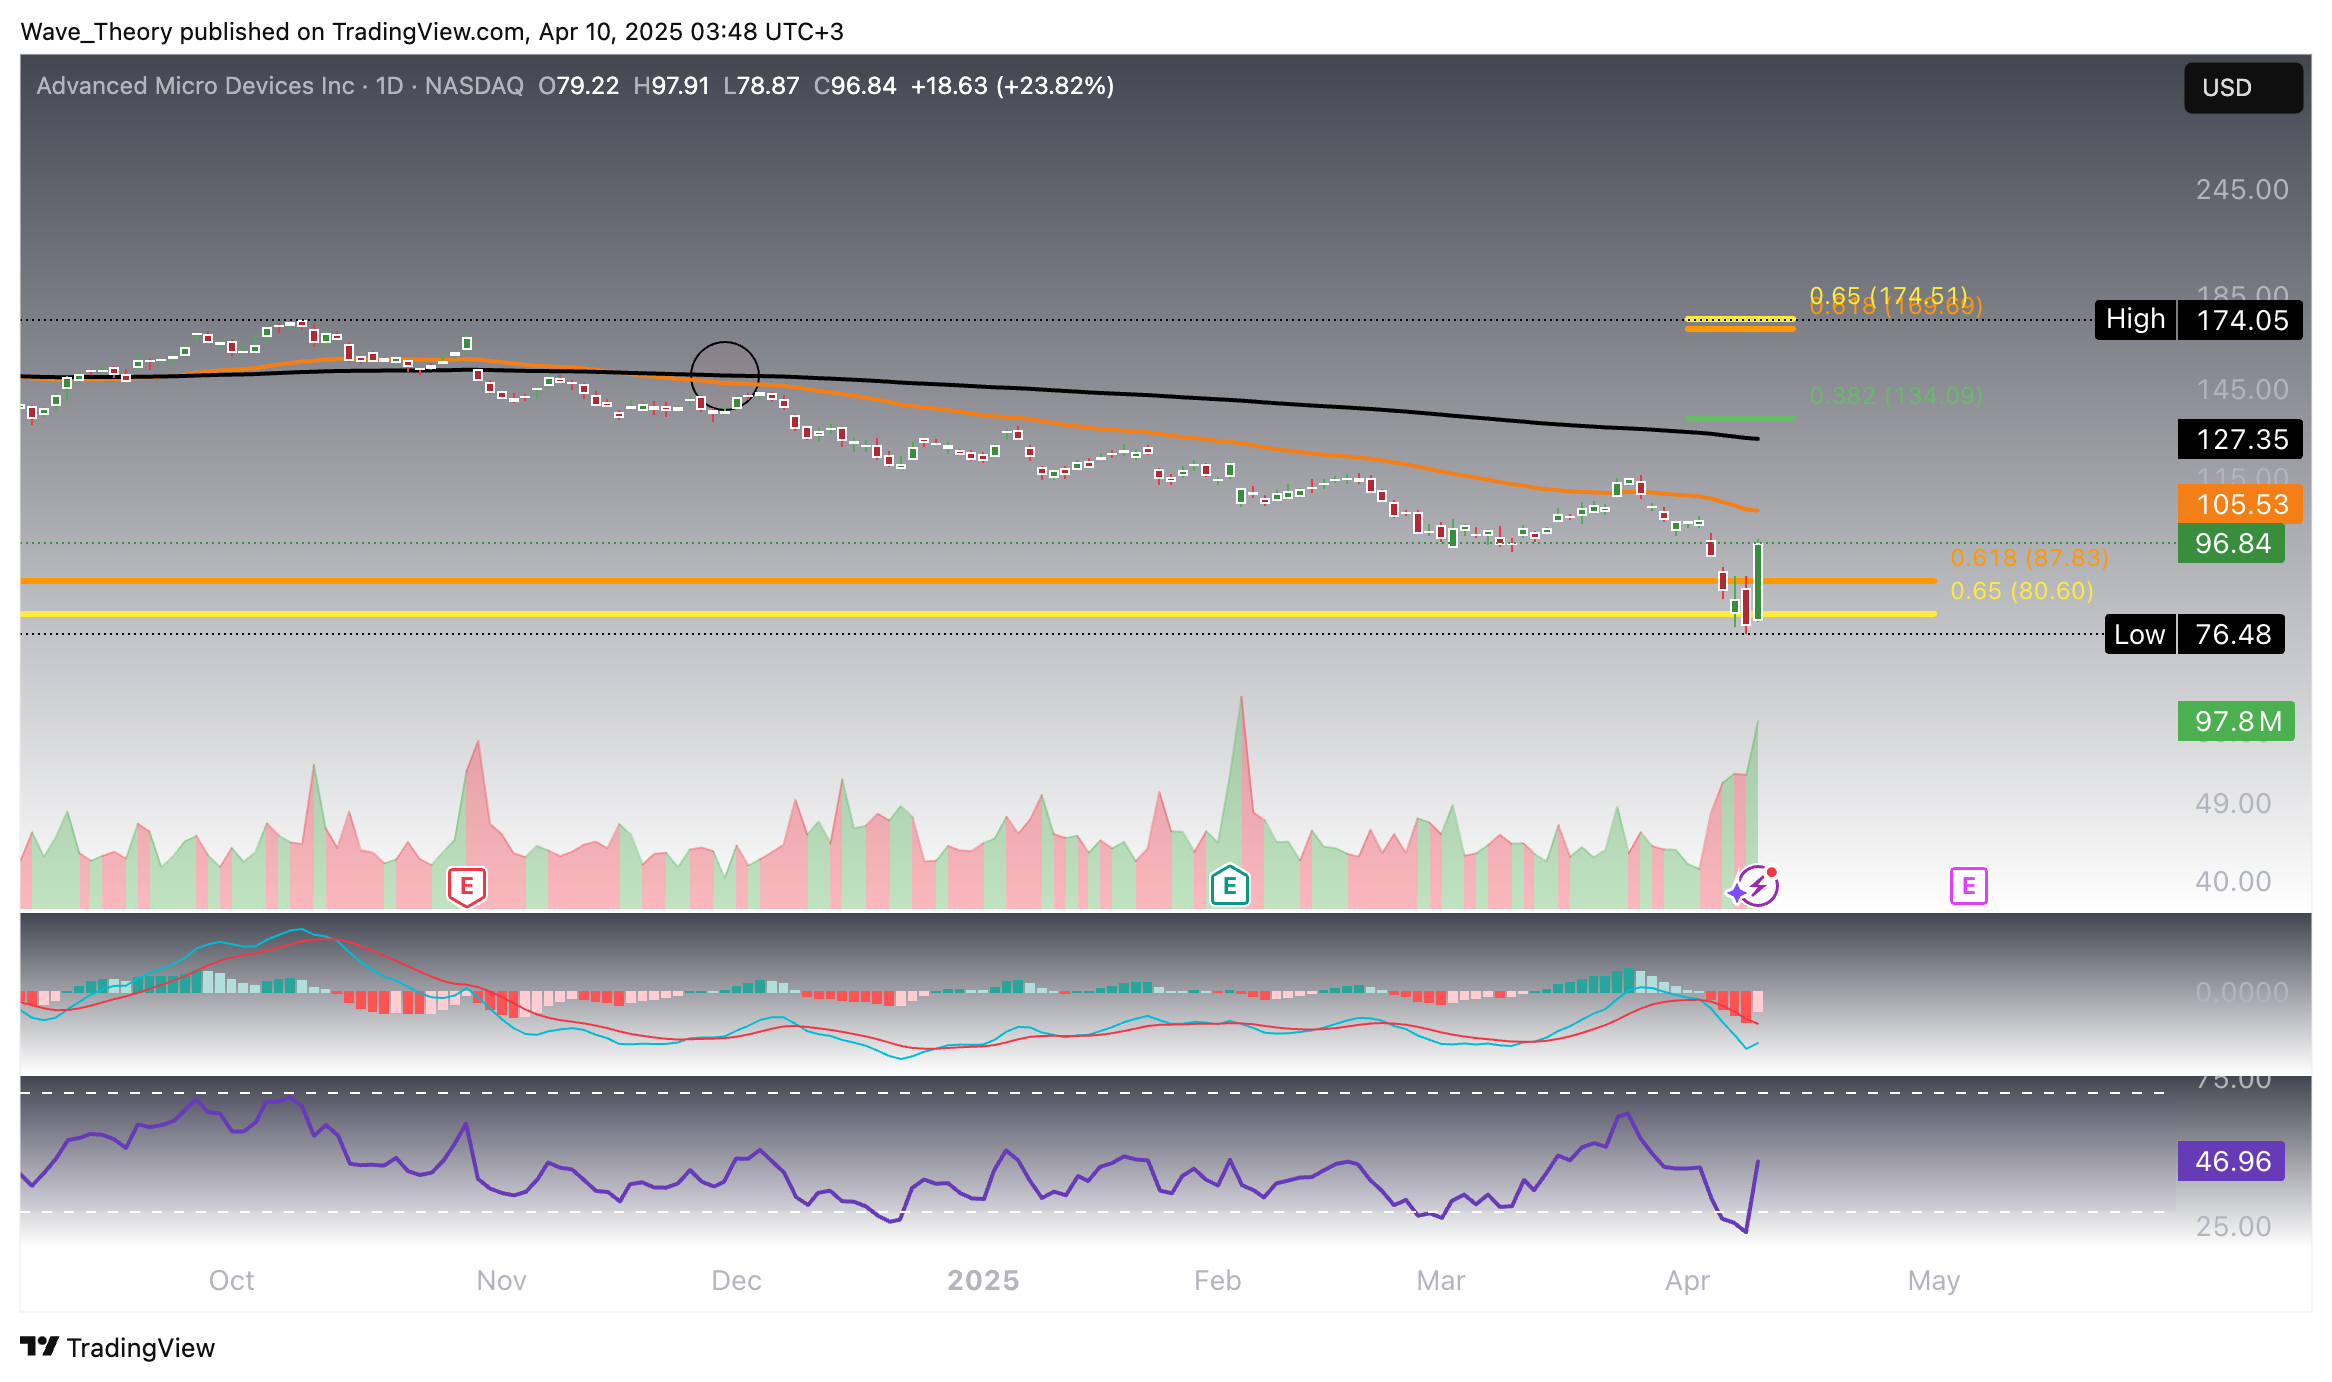
Daily Chart Turns Cautiously Optimistic, But Key EMAs Still Pose Resistance
On the daily chart, the MACD histogram has begun to tick bullishly higher, indicating a potential shift in short-term momentum. However, the MACD lines remain bearishly crossed, and the Exponential Moving Averages (EMAs) are still aligned bearishly, confirming that the prevailing trend remains negative in the short- to medium-term.
The Relative Strength Index (RSI) currently offers no clear directional bias, hovering in neutral territory and reflecting a lack of conviction from momentum traders at this stage.
That said, AMD appears poised for a continued upward move. The next significant technical hurdles are located at the 50-day EMA at $105.5 and the 200-day EMA at $127. A successful breakout above these dynamic resistance levels could accelerate bullish momentum and propel the stock toward the next Fibonacci resistance zones.
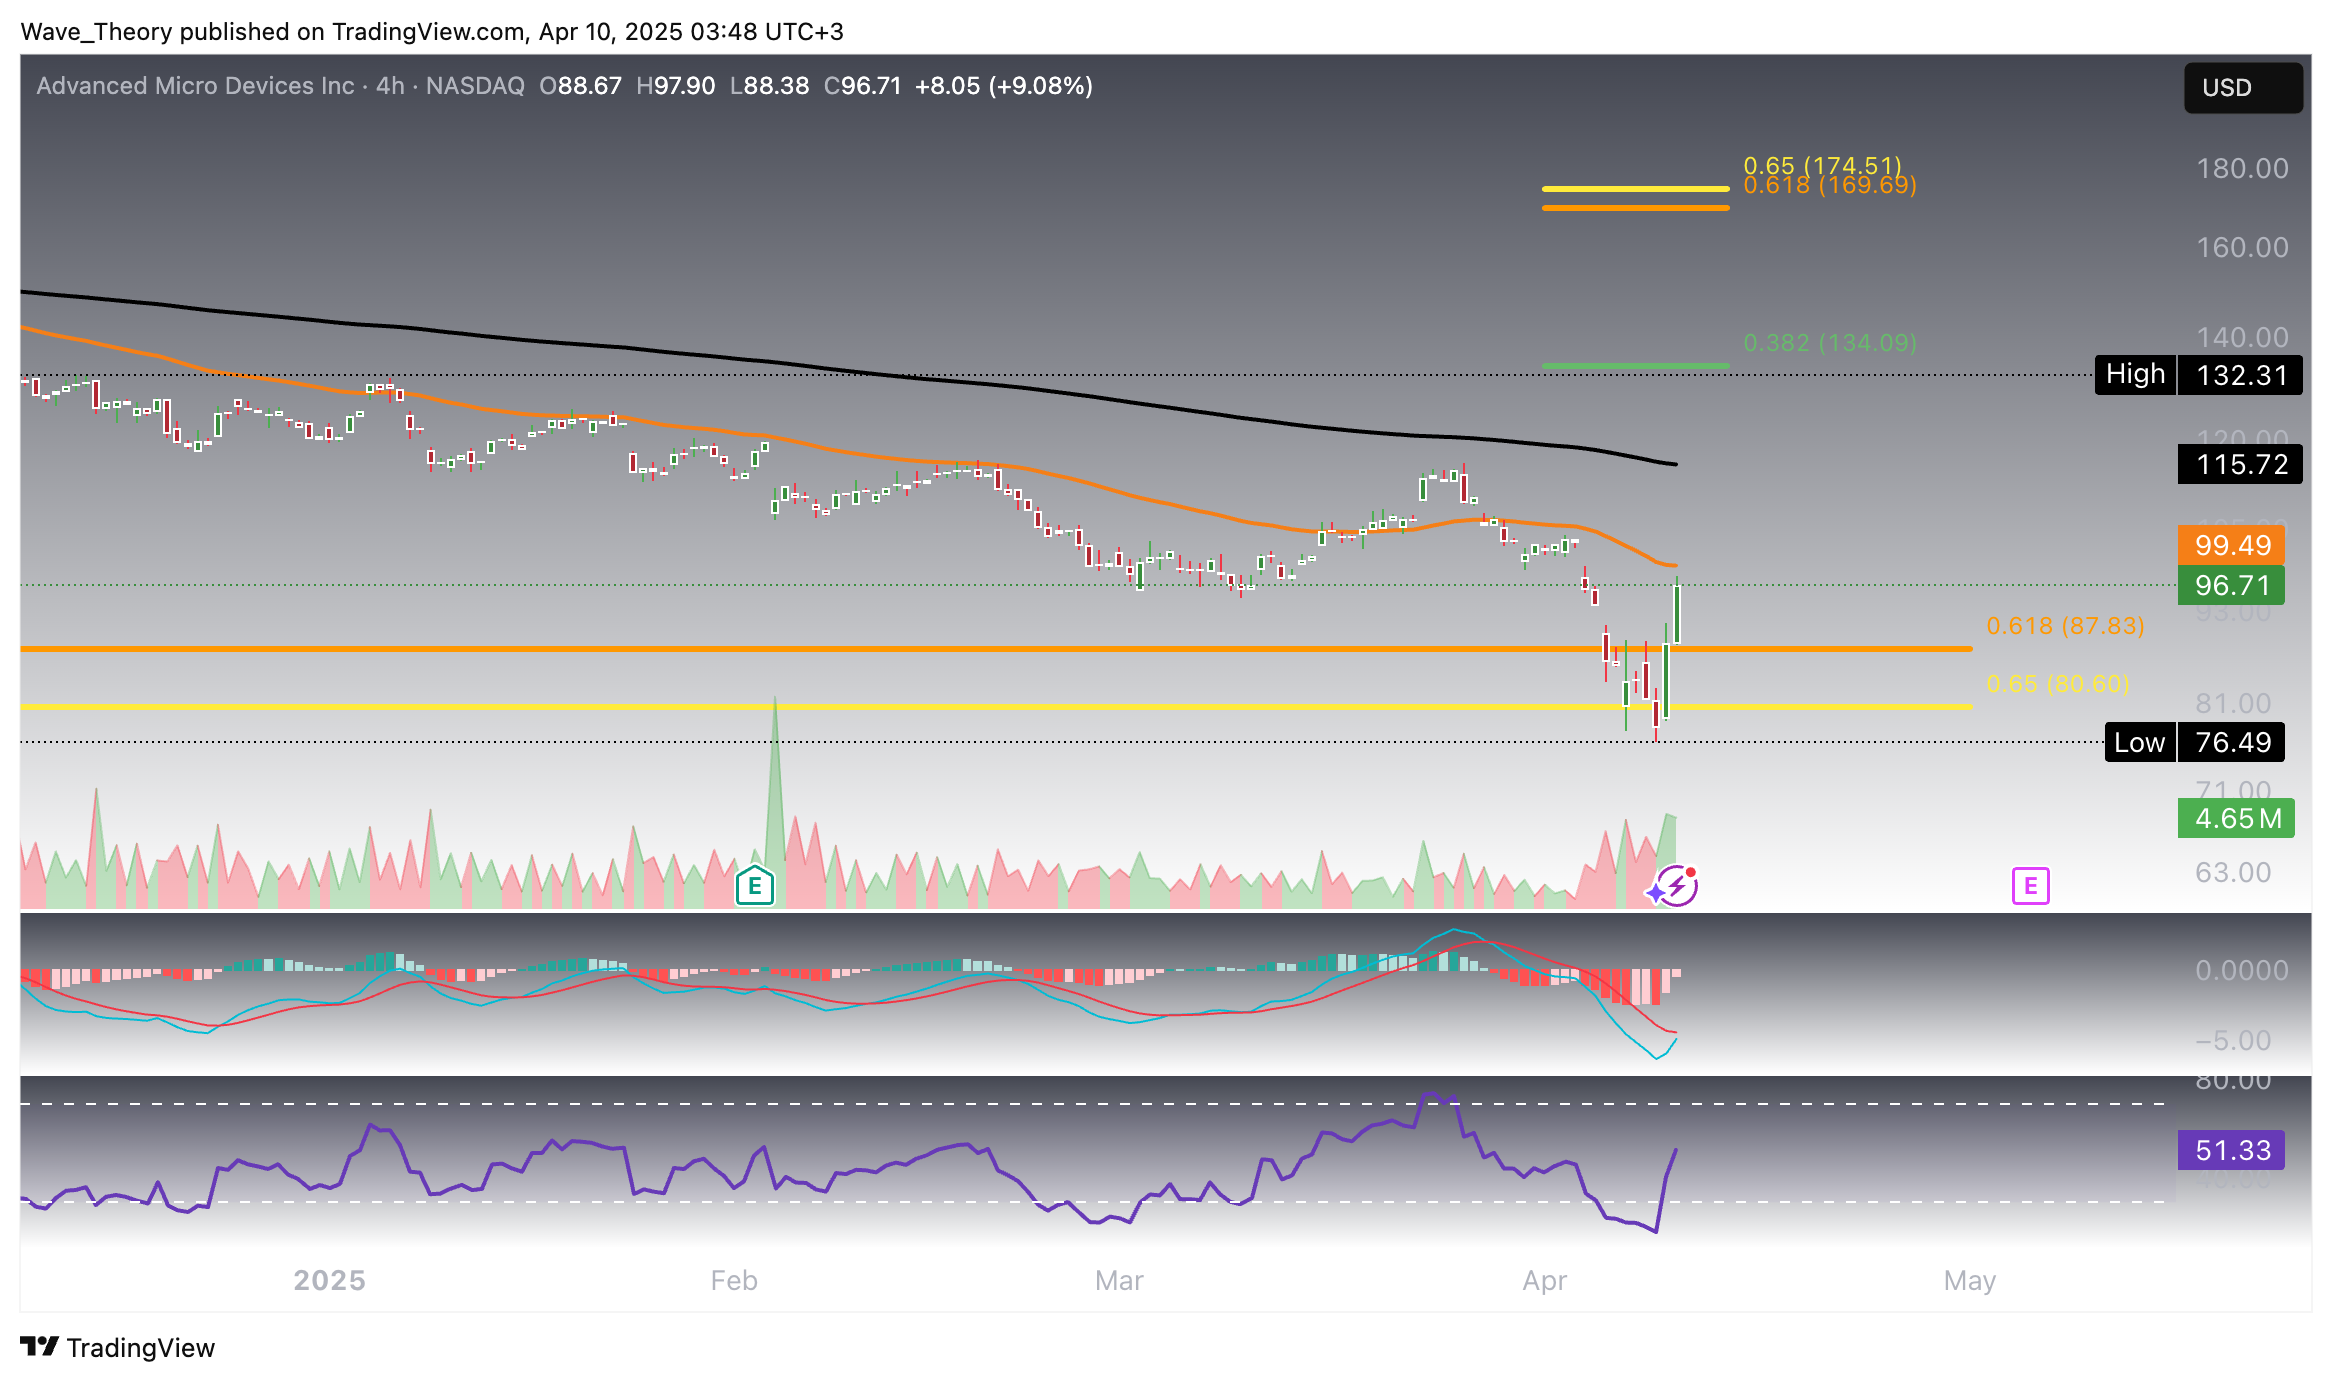
4H Chart Shows Bullish Momentum Building, But Mid-Term Correction Remains Intact
A similar technical picture emerges on the 4-hour chart. While the EMAs still reflect a death cross, maintaining a bearish outlook, there are early signs of bullish momentum building. The MACD lines are on the verge of a bullish crossover, and the histogram continues to tick higher, supporting the case for short-term upside.
Meanwhile, the RSI remains in neutral territory, indicating a lack of overbought conditions and leaving room for further gains.
From a structural perspective, AMD appears to have more short-term upside potential, especially if near-term resistance levels are cleared. However, the broader mid-term trend remains corrective, and the overall downtrend structure has yet to be invalidated. A decisive shift in EMA structure and a break above higher timeframe resistance levels would be required to confirm a full reversal.
- Check out our free forex signals
- Follow the top economic events on FX Leaders economic calendar
- Trade better, discover more Forex Trading Strategies
- Open a FREE Trading Account
Related Articles


Comments
Sidebar rates
Related Posts
