Rout in Oil Prices Intensifies: EIA Data, Tariffs Push WTI Below $57
EIA crude inventories showed another increase today, adding to the decline in crude Oil prices on top of global uncertainties.

Live USOIL Chart

EIA crude inventories showed another increase today, adding to the decline in crude Oil prices on top of global uncertainties.

The latest EIA report presents a mixed picture: crude inventories are still rising but at a slower rate, while refined product stocks (especially distillates) are under pressure due to higher demand or refining limitations. The draw in gasoline and distillates, combined with increased refinery runs, points to seasonal preparation and possibly tightening supply dynamics heading into Q2.
While API data hinted at a crude draw, the EIA’s opposing result may stir some short-term volatility in oil markets. Going forward, distillate weakness and refinery trends could drive sentiment more than crude builds. Watch for further confirmation in next week’s data or any adjustments to refining output forecasts.
EIA Weekly Data (vs Expectations)
Crude Oil Inventories
▪️ Increased by +2.553 million barrels
▪️ Well above expectations of +1.421 million
▪️ Slower build compared to prior week’s large +6.165 million increase
▪️ Indicates continued accumulation but at a moderated paceGasoline Inventories
▪️ Fell -1.6 million barrels
▪️ Slightly more than the expected -1.513 million draw
▪️ Signals healthy demand or tighter supply in refined fuel productsDistillate Inventories (incl. diesel, heating oil)
▪️ Dropped sharply by -3.544 million barrels
▪️ Far worse than the expected +264K build
▪️ Could reflect stronger industrial/commercial demand or limited refining outputRefinery Utilization
▪️ Rose by +0.7%
▪️ Higher than the forecast of +0.5%
▪️ Suggests refiners are ramping up production heading into seasonal demand increases
API Private Inventory Data (Reported Previous Evening)
Crude Oil
▪️ Showed a draw of -1.057 million barrels
▪️ In contrast with EIA’s reported build, suggesting divergent storage trendsGasoline
▪️ Rose +207K barrels, modest inventory buildDistillates
▪️ Fell -1.844 million barrels, aligning directionally with EIA’s larger reported draw
WTI Chart Daily – Persistent Sell-Off Deepens
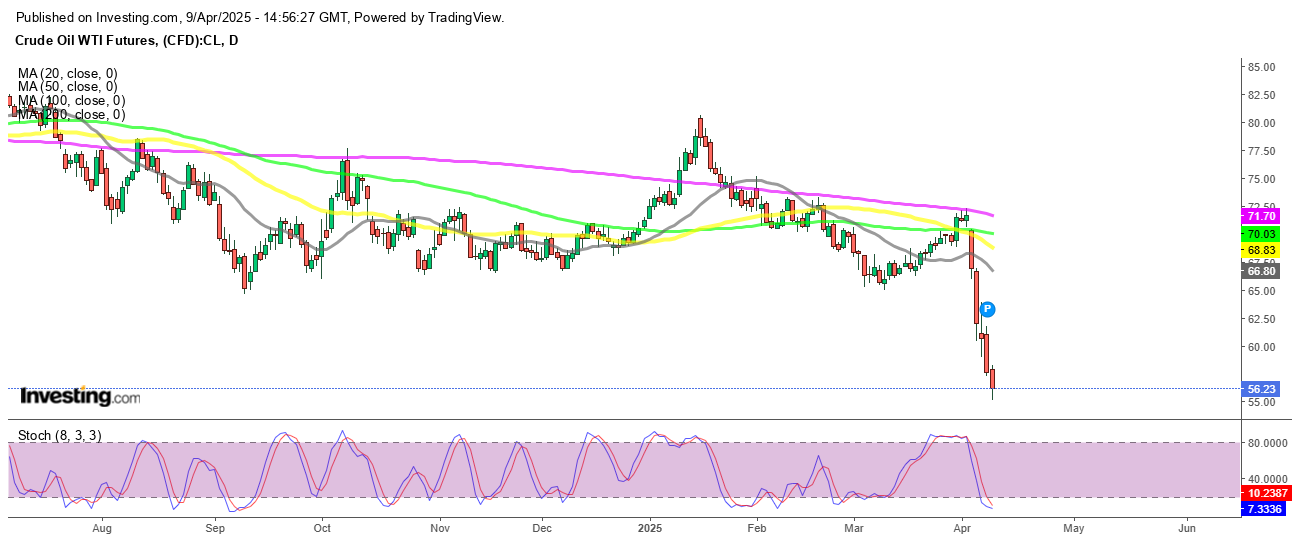
Crude oil extended its sharp decline on Wednesday, with WTI crude dropping to $56.80 ahead of the EIA inventory data. While the report showed only modest changes, prices fell another $0.50 after the release, briefly hitting lows near $55. This marked the fifth straight session of losses and pushed oil to its lowest levels since 2021.
Trade Tensions Fuel Market Anxiety
The latest sell-off was driven largely by renewed trade tensions. After China refused to ease its existing 34% tariffs, the U.S. retaliated with a 50% duty on Chinese imports. The escalation dimmed hopes of a quick trade resolution and raised concerns about slowing global demand, particularly from the world’s two largest economies.
Demand Outlook Under Pressure
Despite a recent inventory build, fears that the trade war could weaken global growth are dominating sentiment. With oil already down over $15 per barrel since the start of the year, many analysts expect further declines unless a major policy shift or supply intervention materializes.
Conclusion
The oil market remains under heavy pressure as trade disputes and economic uncertainty weigh on the demand outlook. Without a breakthrough in negotiations or coordinated action from producers, prices may continue to struggle in the weeks ahead.
US WTI Crude Oil Live Chart
- Check out our free forex signals
- Follow the top economic events on FX Leaders economic calendar
- Trade better, discover more Forex Trading Strategies
- Open a FREE Trading Account
Related Articles
Comments
Sidebar rates
Related Posts
