Daily Crypto Signals: Bitcoin Drops Below $80K Amid Stock Market Fears, XRP Faces Potential 25% Decline
The cryptocurrency market showed mixed signals this weekend as Bitcoin demonstrated relative resilience around the $80,000 level despite
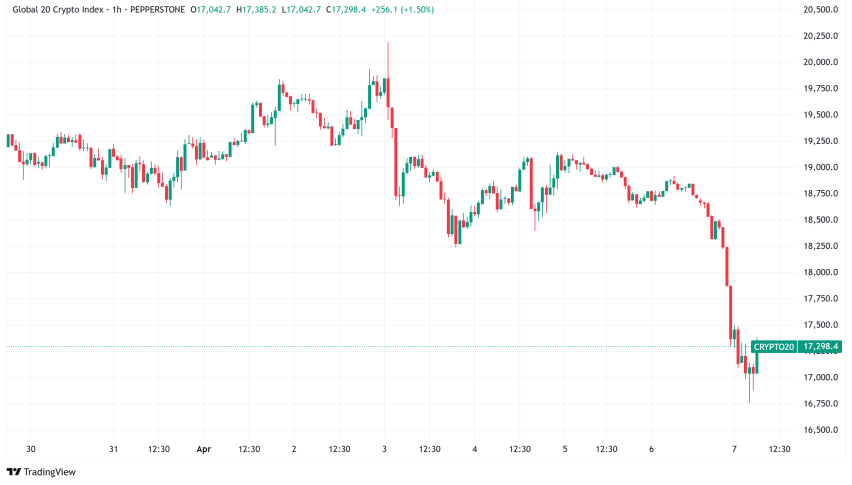
Live BTC/USD Chart

The cryptocurrency market showed mixed signals this weekend as Bitcoin demonstrated relative resilience around the $80,000 level despite global market turbulence sparked by Trump’s tariff policies. Meanwhile, XRP faces a potential 25% decline as bearish technical patterns emerge amid sustained whale distribution activity.
Crypto Market Updates
As worries about U.S. tariff policies spilled over conventional markets, cryptocurrencies markets experienced more volatility. While the S&P 500 and Nasdaq fell almost 6% in one session, crypto assets displayed startling consistency.
With stronger reciprocal tariffs set for April 9, U.S. President Donald Trump’s 10% baseline tariff on all imports became operative April 5. Based on “insufficient time for him to make deals,” billionaire investor Bill Ackman speculated Trump would postpone these tariffs.
Unless they complete KYC verification by the June 1 deadline, almost 400,000 FTX creditors run the danger of losing $2.5 billion in crypto repayments. As Jameson Lopp spoke about Bitcoin address poisoning attacks—scams employing similar-looking addresses to fool consumers into sending money to attackers—security issues also appeared.
Bitcoin Slips Under $80,000
Bitcoin BTC/USD traded at about $79,000 by weekend close, down roughly 3% weekly but showing considerable resilience against more conventional markets. This difference shows in volatility measures: Bitcoin’s volatility kept declining while the VIX index for stocks finished at its highest level since the 2020 COVID fall.
Jim Cramer of CNBC expressed worries about a “October 87 scenario,” even if market circuit breakers could help to lessen severe fall. Max Keiser, a Bitcoin maximalist, boldly predicted that as investors sought safe havens, a market collapse would drive Bitcoin to $220,000.
If selling keeps on, technical analysts note $76,000 as a possible support level; some even propose this could indicate a “fake breakdown” akin to trends following the ETF acceptance. Many remain carefully hopeful about Bitcoin perhaps detaching further from risk assets if economic uncertainty gets more intense.
More Bearish Pressure in XRP?
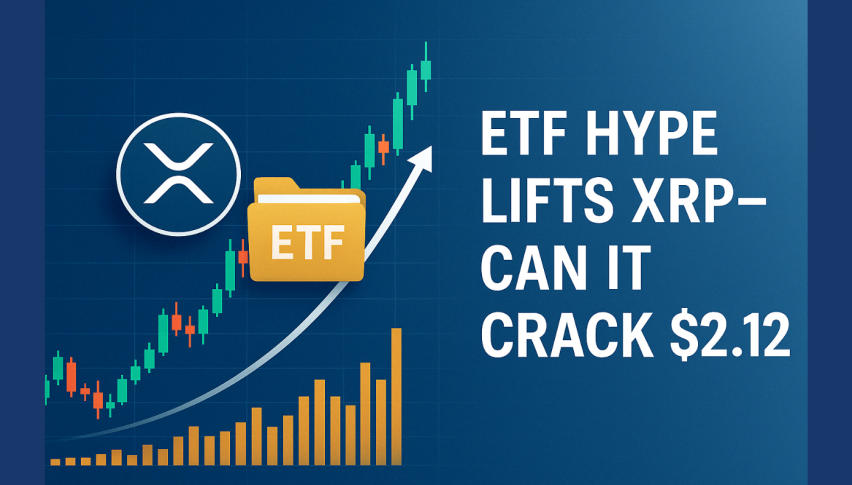
With on-chain data pointing to significant downside pressure, XRP XRP/USD has already dropped more than 35% from its January high of $3.40 trading around $1.93. Technical analysts have found a “inverse cup and handle” shape, a bearish reversal pattern warning declining momentum.
The “handle” in the design moves sideways between $2.05 and $2.20. A collapse below this area might confirm the bearish structure and maybe send XRP toward $1.58. Supporting this view, whale flow charts showing consistent net withdrawals from XRP’s biggest holders since late 2024 point to distribution rather than accumulation.
Should XRP close above the 50-period 4-hour exponential moving average close to $2.14, this would invalidate the negative case and indicate fresh momentum towards $2.28.
Solana Tests Support at $100
Solana SOL/USD still exhibiting amazing basic increase even with a 9% price drop of about $107. Approaching 53.8 million SOL (about $6.5 billion), the network’s total value locked peaked in June 2022 and clearly leads rival BNB Chain.
With distributed exchange volumes, Solana keeps a 24% market share while BNB Chain only boasts a 12%. This strength arises despite a recent staking unlocking of 1.79 million SOL and falling memecoin interest, which had fueled notable user adoption.
With top apps including Jito, Jupiter, and Kamino, Solana has solidified its position as the second-largest DeFi ecosystem behind Ethereum despite questions concerning validator methods.
Top Altcoins to Watch Today
Several altcoins are showing strength despite market uncertainty:
- Pi Network (PI) shows signs of accumulation after declining from February’s $3 high. If PI breaks above the 20-day EMA ($0.85), it could target $1.10, although $0.40 remains critical support.
- OKB broke above key moving averages and resistance at $54, forming what appears to be an inverted head-and-shoulders pattern. A break above its descending channel could target $64 and potentially $70.
- GateToken (GT) has established support at its 50-day SMA ($22.05). A break above $23.18 could send GT toward $24 and potentially $26.
- Cosmos (ATOM) is attempting to form a bottom while facing resistance at $5.15. Currently trading around $4.52, ATOM could target $6.50 if buyers overcome immediate resistance.
- Check out our free forex signals
- Follow the top economic events on FX Leaders economic calendar
- Trade better, discover more Forex Trading Strategies
- Open a FREE Trading Account
Related Articles
Comments
Sidebar rates
Related Posts
