


S&P 500 (SPX) Approaches Key Support Levels: Will It Bounce or Extend Correction?
S&P 500 (SPX) Eyes Golden Ratio Support At 5,400
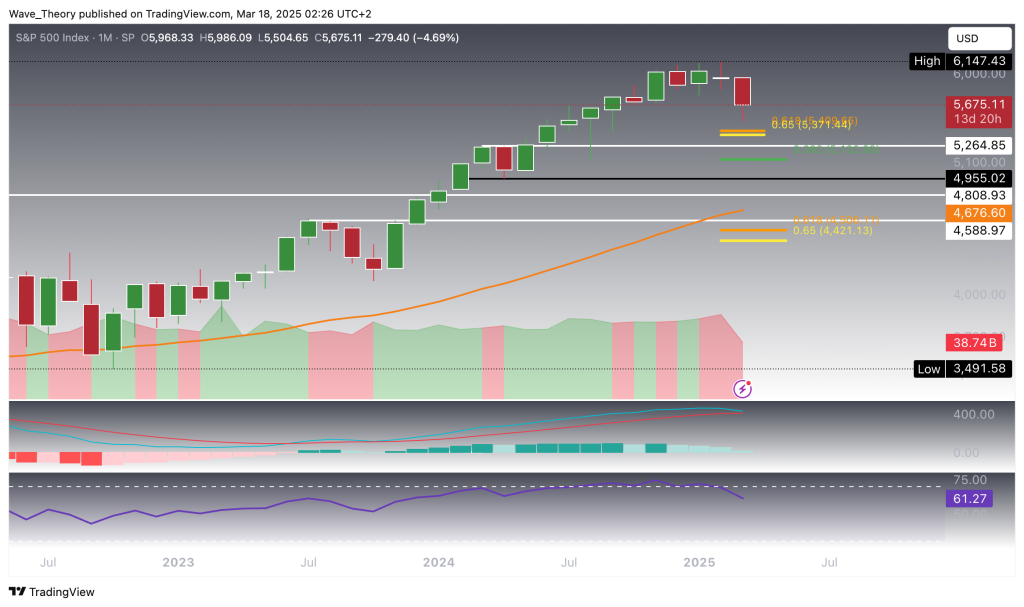
The S&P 500 (SPX) has retraced approximately 10.5% since reaching a high near 6,150 last month, correcting steadily over the past six weeks. During this period, the MACD histogram has been ticking bearishly lower for four consecutive months, with the MACD lines on the verge of a bearish cross. Meanwhile, the RSI is exiting overbought territory and heading toward neutral levels. SPX is approaching a crucial golden ratio support level at 5,400, which could serve as a potential bounce point for a bullish reversal.
S&P 500 (SPX) Faces Major Support at the 50-Week EMA
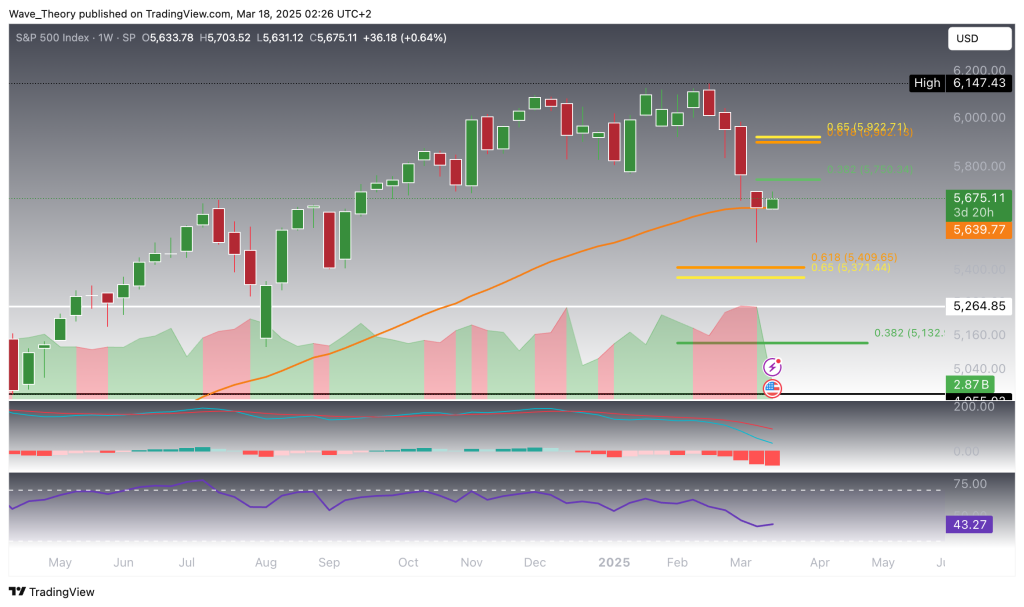
The S&P 500 is testing significant support at the 50-week EMA, around 5,640, and appears to be bouncing off this level. If this support holds, the index could target key Fibonacci resistance levels at 5,750 and 5,920. However, if the support fails, a deeper retracement to the golden ratio support at 5,400 is possible, as technical indicators show a largely bearish outlook.
Technical Indicators and Trends (Weekly Chart)
- MACD (Moving Average Convergence Divergence): The MACD lines are bearishly crossed, with the histogram in a five-week downtrend.
- RSI (Relative Strength Index): The RSI remains in neutral territory, offering no clear directional signal.
- EMAs (Exponential Moving Averages): Despite bearish signals, the EMAs remain bullishly crossed, suggesting the mid-term trend still leans bullish.
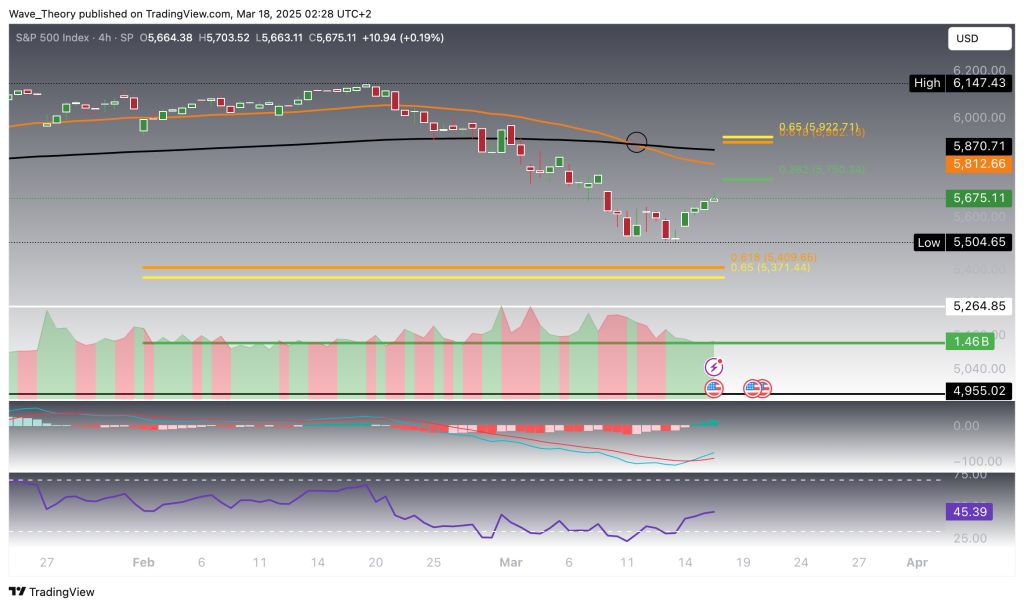
More Weakening Bullish Momentum in the 4H Chart
On the 4-hour chart, the technical indicators are sending mixed signals, suggesting uncertainty in the short-term trend.
Technical Indicators and Trends (4H Chart):
- MACD (Moving Average Convergence Divergence): The MACD lines are bullishly crossed, with the histogram ticking higher, showing a slight bullish momentum.
- RSI (Relative Strength Index): The RSI is in neutral territory, providing no clear directional bias.
- EMAs (Exponential Moving Averages): A death cross has formed, confirming a bearish trend in the short-term.
Despite these bearish signs, SPX still has the opportunity to continue its upward movement. The upcoming Fibonacci resistance levels are critical in determining whether SPX will return to its uptrend or extend the current correction phase.


Sidebar rates
Add 3442

Related Posts
Add 3440

