


Tesla (TSLA) Approaches Critical Golden Ratio Support Level: Will a Bullish Reversal Follow?
Tesla (TSLA) Stock Reaches Major Golden Ratio Support Level
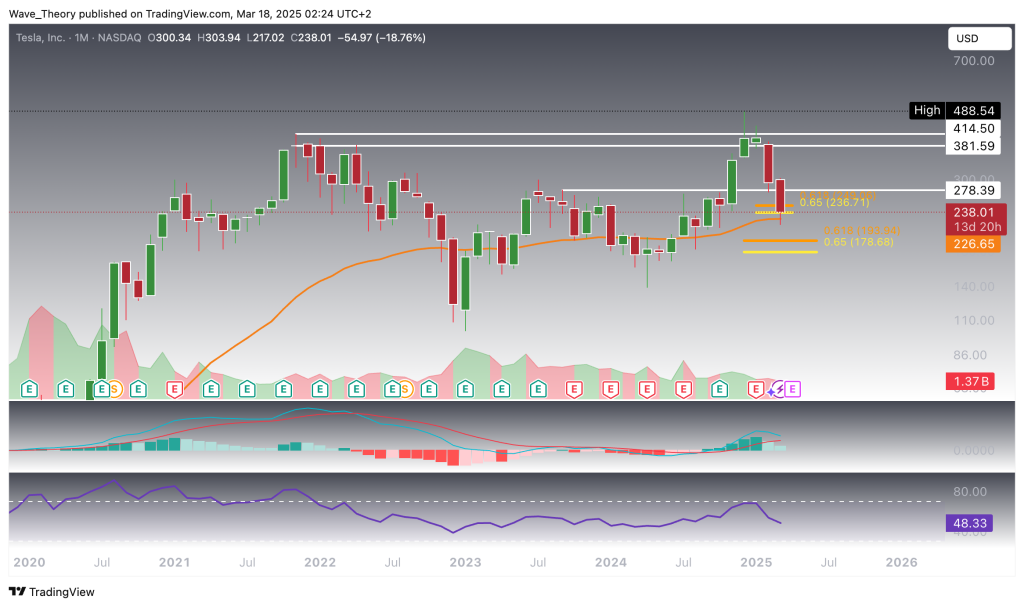
Tesla (TSLA) Faces Key Inflection Point: Will it Break Support or Resume its Bullish Trend?
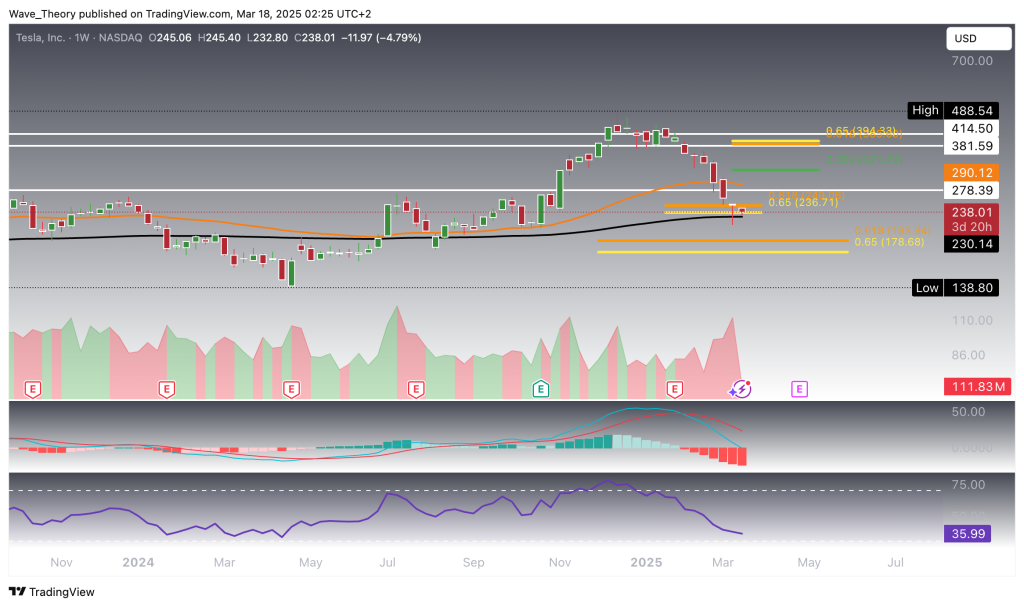
If Tesla (TSLA) fails to bounce off the current golden ratio support at $226, the stock could decline further to the next crucial golden ratio support at $180. The weekly indicators are predominantly bearish, with the MACD lines already crossed bearishly and the histogram trending downward for several weeks. However, the RSI remains in neutral territory, and the EMAs still display a golden crossover, which confirms the bullish trend in the mid-term.
Should Tesla bounce off bullishly from current levels, it could rally toward the next significant Fibonacci resistance points at $321 and $390. A break above the golden ratio resistance at $390 would signal the end of the correction phase, propelling Tesla back into a bullish uptrend.
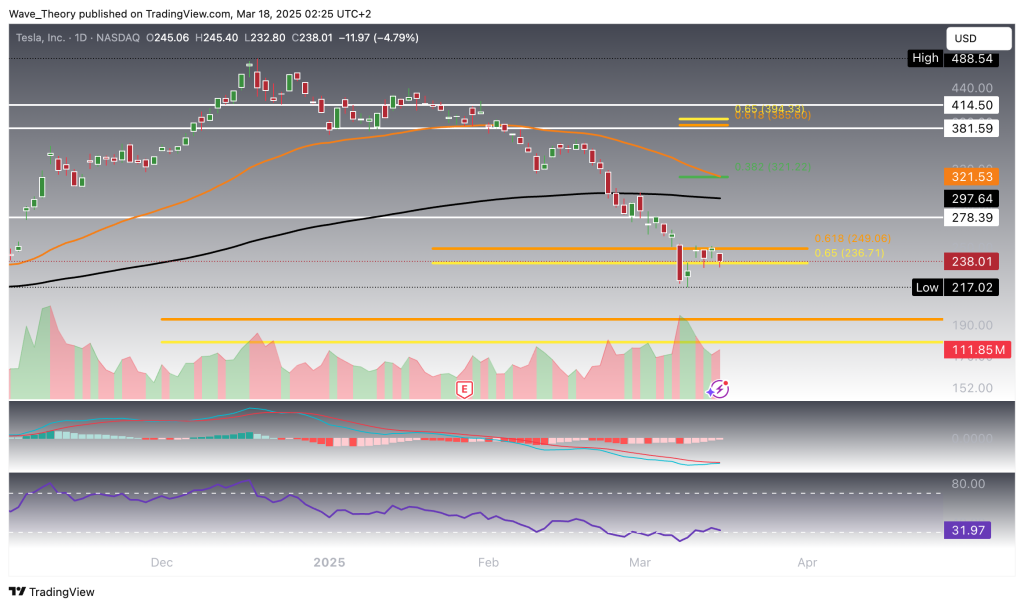
Tesla (TSLA) Shows Mixed Signals on the Daily Chart: Death Cross Looms, but Momentum Builds
On the daily chart, Tesla faces a potential death cross, where the 50-day EMA could cross below the 200-day EMA, confirming a bearish trend in the short- to medium-term. This looming crossover suggests caution. However, the MACD lines are on the verge of crossing bullishly, with the MACD histogram ticking higher for the past five days, signaling potential upward momentum. Meanwhile, the RSI hovers in neutral territory, offering no clear direction yet, leaving the stock’s near-term path uncertain.
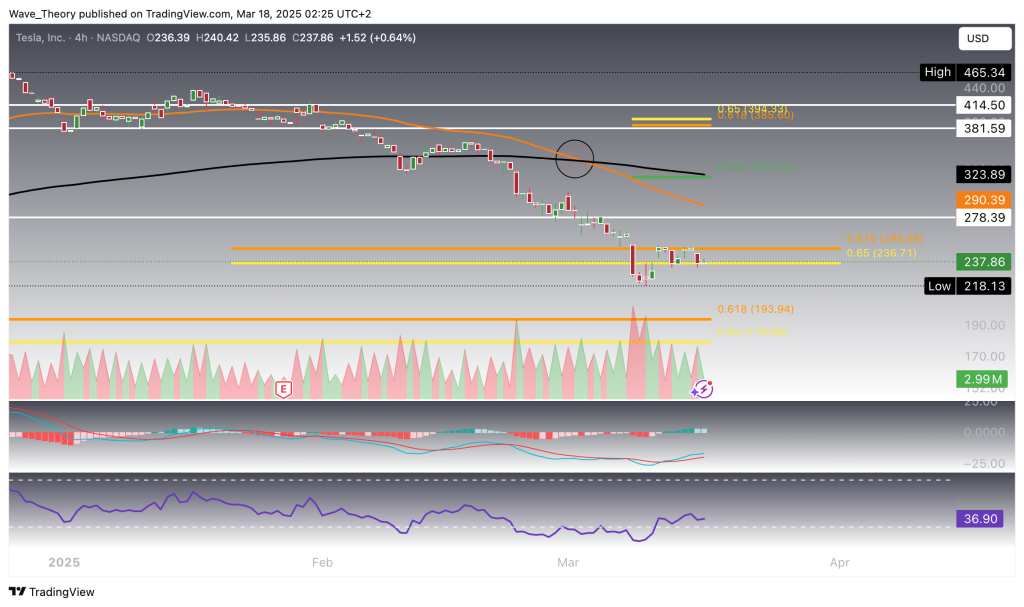
Death Cross On The 4H-Chart Confirms Bearish Momentum
On the 4H chart, Tesla has formed a death cross with its EMAs, signaling bearish momentum in the short-term. Additionally, the MACD histogram is ticking lower, indicating waning bullish strength. Despite this, the RSI remains neutral, and the MACD lines are crossed bullishly. TSLA still has the opportunity to rebound either at current levels or near the golden ratio support between $178 and $194.


Sidebar rates
Add 3442

Related Posts
Add 3440

