


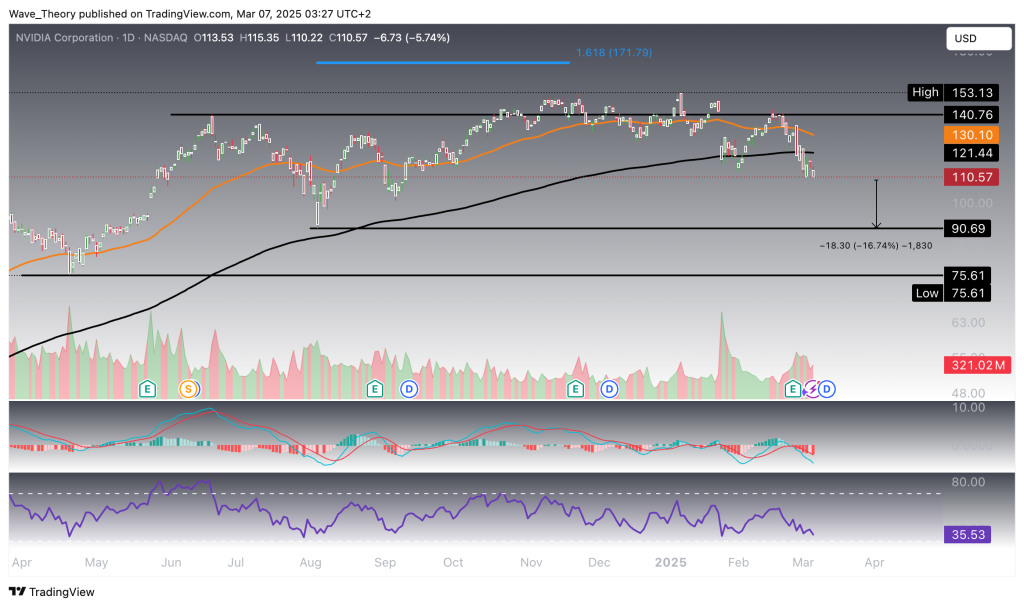
On the daily chart, while the EMAs still maintain a golden crossover, confirming a bullish trend in the short- to medium-term, there is a potential for a death cross to form. The MACD lines are already crossed bearishly, and the histogram is ticking lower, signaling downward momentum. Additionally, the RSI is nearing oversold regions. Should NVDA decline further, there is an estimated 17 % downside potential until it reaches major support.
Nvidia Stock (NVDA) Extends Correction Phase: Is More Downside on the Horizon?
Konstantin Kaiser•Friday, March 7, 2025•2 min read

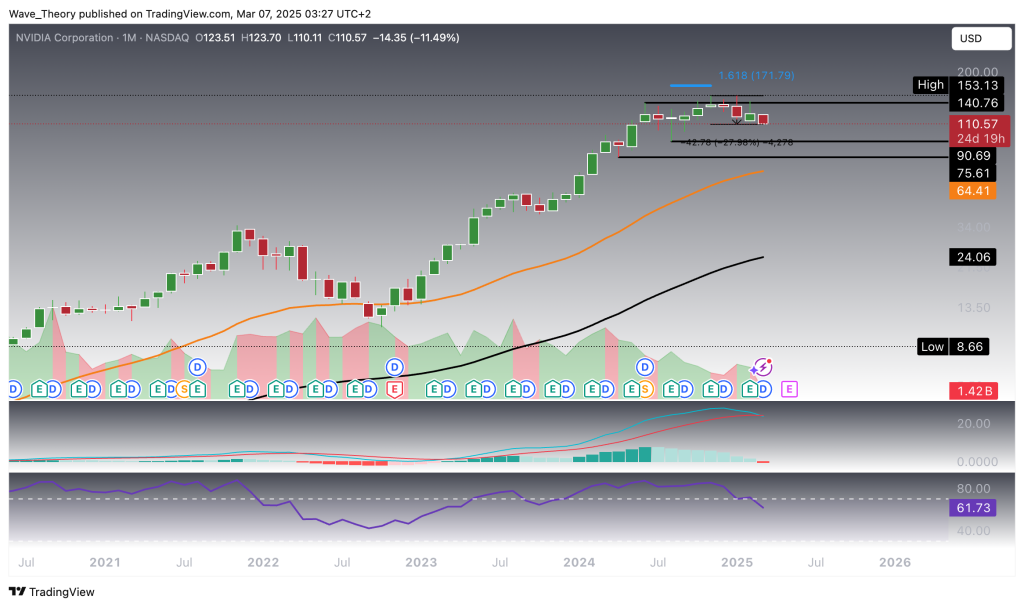
Nvidia (NVDA) Declines by 28%
Nvidia (NVDA) failed to reach the Fibonacci projection level at $171.8, instead closing below the horizontal resistance around $141. Since then, the stock has experienced a 28% decline, with mixed signals from the technical indicators.
Technical Indicators and Trends (Monthly Chart)
MACD (Moving Average Convergence Divergence): The MACD lines are nearing a bearish crossover, with the histogram showing a downtrend.
RSI (Relative Strength Index): The RSI is moving out of overbought territory, heading back to neutral levels.
EMA (Exponential Moving Average): Despite the decline, the EMAs still show a golden crossover, signaling the long-term bullish trend remains intact.
Check out our free forex signals
Follow the top economic events on FX Leaders economic calendar
Trade better, discover more Forex Trading Strategies
Konstantin Kaiser
Financial Writer and Market Analyst
Konstantin Kaiser comes from a data science background and has significant experience in quantitative trading. His interest in technology took a notable turn in 2013 when he discovered Bitcoin and was instantly intrigued by the potential of this disruptive technology.
Related Articles


Comments
Subscribe
Login
Please login to comment
0 Comments
Oldest
Sidebar rates
Related Posts
Add 3440

