


Solana Faces $431M Sell-Off: Will the Price Drop Below $100?
Solana (SOL) is under heavy selling pressure after FTX’s latest token unlock of 3.03 million SOL, worth $431.3 million.

The crypto which had reached a yearly high is now down 19% in the last 24 hours to $136.
Current price: $136 (-19%)
Market cap: $70.16 billion (-19%)
Trading volume: $9.56 billion (-24%)
The timing of this drop coincides with new US tariffs on Mexico and Canada which has caused a broader crypto market sell off. But the main factor affecting SOL is still the FTX liquidations with more token unlocks to come in the next months.
The Solana TVL has plunged below $7 billion, and experts predict a potential SOL price drop to $100. As Solana’s support at $128 weakens, many investors are flocking to DTX Exchange, if Solana’s $128 support level breaks, forced selling could drive prices further down. pic.twitter.com/cTQzspzUpu
— Cryptostan.official (@The_Cryptostan) March 3, 2025
FTX’s Massive Unstaking: What It Means for SOL
As FTX restructure its assets to recap investors millions of SOL tokens have been unstaked and transferred to various wallets causing selling pressure. So far:
3.03 million SOL ($431.3M) unstaked
24,799 SOL ($3.38M) already sent to Binance
More unlocks expected in April and beyond
Big token unlocks usually cause market instability as investors fear increased liquidity could drive prices lower. This has led to speculation whether Solana could go below $100 in the next weeks.
Will Solana Drop Below $100? Market Signals Say No
Despite the downward momentum Solana may not go below $100:
Strong Rally History: Solana was at $177.88 yesterday, showing high buying interest and trading volume.
Key Liquidation Levels: Coinglass data shows that $300M in liquidations would happen if SOL reaches $127, triggering a price bounce.
Bitcoin’s Seasonal Strength: Historically March is a bullish month for Bitcoin which could help altcoins to recover.
Will #Solana Price Crash Below $100 Amid FTX’s $430M Unlock?
— Coin Jupiter (@coinjupiter) March 4, 2025
While short term volatility is high Solana’s fundamentals and history of resilience suggest it will stabilize above $120 and a crash below $100 is unlikely.
Solana Price Prediction – Technical Analysis
Solana is at $136.05 just above the ascending trendline after a sharp drop from $180.05. It’s testing a crucial support level with $124.84 as the next major target if selling continues.
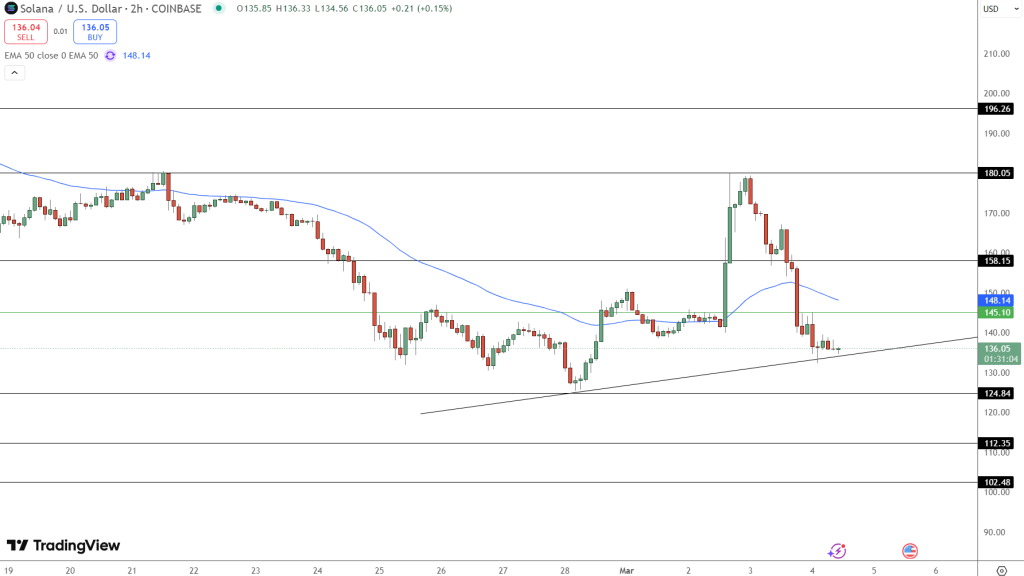
The 50 EMA at $148.14 is the immediate resistance and the broader bearish structure. A move above $145.10 could be a sign of a bounce, with next resistance at $158.15. But if we can’t hold the trendline, it could be a drop to $124.84 and then $112.35.
Watch for a break above $145 for bullish confirmation or below the trendline for a deeper correction. Market is weak and a strong move in either direction will determine Solana’s short term trend. A move above the 50 EMA will shift the sentiment to bullish.

Sidebar rates
Related Posts
Add 3440

