ETH Plummets 14% to Under $2,100: Is $2,000 Support the Last Stand Before Further Decline to $1,880?
Ethereum (ETH) has experienced a sharp downturn, currently trading under $2,100 and marking a significant 14% drop in the last 24 hours.
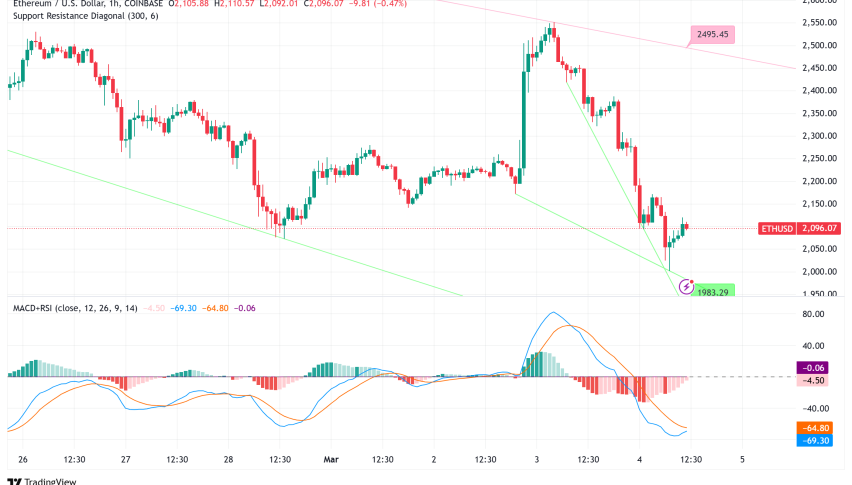
Live ETH/USD Chart

Ethereum (ETH) has experienced a sharp downturn, currently trading under $2,100 and marking a significant 14% drop in the last 24 hours. This drastic price movement follows a failure to breach the $2,550 resistance zone, triggering a fresh wave of bearish momentum across the market.
Earlier optimism fueled by Trump’s crypto strategic reserve announcement and Ethereum Foundation leadership changes has been swiftly replaced by investor profit-taking and mounting short positions. Concerns are now escalating as technical indicators point towards further potential downside, with key support levels at $2,000 and $1,880 coming into focus.
Lazarus Group’s $1.39B Laundered ETH Amplifies Market Pressure
Complicating the already bad situation of the market, fresh investigations reveal that all 499,000 ETH, valued $1.39 billion, stolen from Bybit has been successfully laundered by the infamous North Korean hacking group Lazarus Group. This enormous unloading of once illegally acquired ETH into the market most certainly helped to cause the current price collapse. During the fund movement ETH’s price dropped 23% from $2,780 to $2,130 throughout the laundering procedure, which took just 10 days.
Short-Term ETH/USD Technical Analysis: Bearish Trend Line and $2,160 Resistance Block Recovery
Ethereum’s ETH/USD technical analysis points up a worrying short-term technical picture. At $2,250 and the 100-hourly Simple Moving Average, Ethereum has dropped below vital support and shows a definite change in momentum toward sellers. Further underlining this negative trend on the hourly chart is a recently developed bearish trend line with opposition at $2,160. While the Moving Average Convergence Divergence (MACD) picks bearish momentum, the hourly Relative Strength Index (RSI) has dropped below 50, indicating declining buying pressure.
ETH has to clearly surpass the $2,160 and $2,250 resistance levels for any possible recovery. Ignoring this could open the path for more falls. Near $2,020, immediate support is noted; a critical support zone falls at $2,000. A break below this $2,000 level might cause a quick decline toward $1,880 and maybe even down to $1,750 or $1,640 in the near future.
Traders Flag Rapid ETH Price Decline and Increased Bearish Activity
Complementing the short-term bearish story, crypto trader Trader_XO saw a quick 1.87% price decline on March 3rd inside just 15 minutes. This quick drop together with a notable increase in trading volume across ETH/USD and ETH/BTC pairs suggests increased sell-off pressure.
This was confirmed by on-chain data showing a rise in active addresses and transaction volume, implying a general market reaction and maybe profit-taking or loss-cutting. Technical indicators during this period confirmed the negative signal even further: the RSI dropped from overbought zone, Bollinger Bands broadened showing more volatility, and the MACD displayed a bearish crossover.
Ethereum Price Prediction: $6,000 Target vs. $1.8B Bearish Resistance at $2,400
Long-term study presents a more complicated picture, even if short-term indications show a worrying picture. With great support at $2,150 and a resistance objective at roughly $6,004, legendary trader Peter Brandt has found a “potential 11-month rectangle” chart pattern for Ethereum. According to Brandt’s study, a breakout over the resistance of the rectangle might generate significant purchasing demand and drive ETH toward the $6,000 price goal.
Still, new market dynamics expose notable bearish resistance developing in the middle term. Short-term traders quickly participated in “sell-the-news” profit-taking despite first optimistic catalysts from Trump’s crypto strategic reserve declaration and Ethereum Foundation leadership changes.
Bears around the $2,400 price level are deploying a large $1.8 billion in short bets, therefore eclipsing the $832 million in long positions. This powerful resistance zone created by this dominant bearish leverage essentially stops any instantaneous upward price movement beyond $2,400.
Technical analysis applying the Keltner Channel supports even more this bearish mid-term consolidation scenario. With Ethereum’s struggle below the Keltner Channel midline around $2,489 and declining Accumulation/Distribution (A/D) indicator point pointing likely ongoing selling pressure and possible capital outflows.
Long-Term Bullish Potential Remains Conditional; Short-Term Consolidation and Potential Downside Risk
Should the bearish momentum continue, the $2,066 level becomes the next possible support. Rising above the $2,489 Keltner Channel midline will invalidate the bearish view and allow a rebound towards $2,912.
Ethereum’s pricing path is still unstable for now. Traders should be careful, keep a close eye on the $2,000 support level, and look for any changes in market mood that can throw off the already prevailing bearish control. While the long-term potential depends on breaking the established bearish resistance and reigniting bullish momentum, the short-term focus is on whether ETH can maintain above $2,000 to prevent a deeper slide towards $1,880.
- Check out our free forex signals
- Follow the top economic events on FX Leaders economic calendar
- Trade better, discover more Forex Trading Strategies
- Open a FREE Trading Account
Related Articles


Comments
Sidebar rates
Related Posts
