AUDUSD at Crossroads as Australian Inflation Remains Sticky but Trade Tensions Weigh
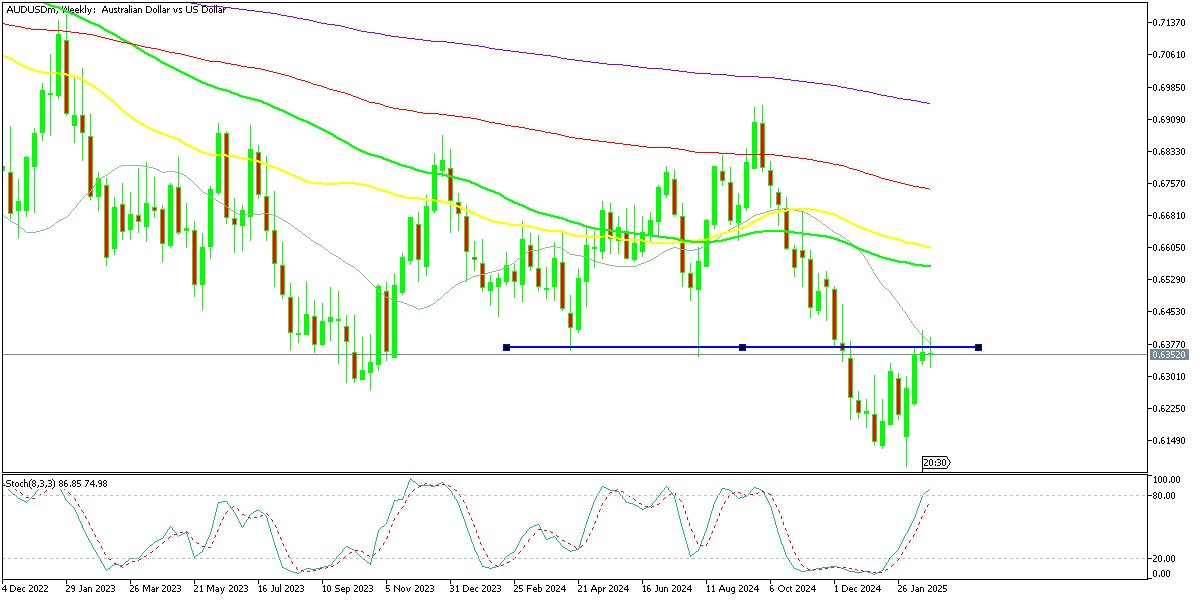
AUD/USD is testing the 200 weekly SMA at 0.64, as Australian inflation CPI remains sticky.

Live AUD/USD Chart

AUD/USD is testing the 200 weekly SMA at 0.64, as Australian inflation CPI remains sticky.
The AUD/USD pair has faced persistent bearish pressure since October of last year, largely driven by a stronger U.S. dollar. Despite showing some recovery in February and briefly climbing above 0.64, buyers struggled to maintain momentum, with the 20 SMA acting as resistance on the weekly chart. Over the past two weeks, the pair has remained below 0.64, while the stochastic indicator signals overbought conditions.
Earlier this month, AUD/USD broke below its 2022 lows, dropping to levels not seen since 2020 during the peak of the coronavirus crisis, falling under 0.61. However, a strong rebound followed as the U.S. dollar weakened, partly due to tariff concerns proving to be less severe than initially feared.
AUD/USD Chart Weekly – The 20 SMA acting As Resistance
Recent CPI data has been encouraging for the Reserve Bank of Australia (RBA), though its impact on the Australian dollar has been more muted. Inflation remains within the RBA’s target range of 2% to 3%, aligning with government policy. However, the core inflation measure, known as the trimmed mean in Australia, has shown a slight increase. While still below 3%, this could be a factor to watch in upcoming monetary policy decisions.
Australian Monthly CPI (January 2025) Overview
Headline CPI:
- Increased by 2.5% year-over-year (y/y) in January 2025.
- Fell slightly short of the 2.6% forecast, matching December’s figure of 2.5% y/y.
Trimmed Mean CPI (Core Inflation):
- Rose to 2.8% y/y in January, compared to 2.7% y/y in December.
- Indicates a slight upward trend in underlying inflation pressures.
Analysis & Market Impact
- The headline CPI remaining steady at 2.5% suggests inflation is stabilizing within the Reserve Bank of Australia’s (RBA) target range of 2-3%.
- The rise in trimmed mean CPI hints at persistent underlying price pressures, which could influence the RBA’s monetary policy stance.
- The lower-than-expected inflation reading may ease concerns over aggressive rate hikes, potentially keeping the Australian dollar (AUD) under pressure.
While inflation remains within the RBA’s target range, the slight increase in core inflation could signal ongoing price pressures. The data may lead to cautious optimism from the RBA, with future rate decisions hinging on whether core inflation continues to rise. Markets will be watching upcoming economic indicators and central bank statements for further guidance on policy direction.
AUD/USD Live Chart
- Check out our free forex signals
- Follow the top economic events on FX Leaders economic calendar
- Trade better, discover more Forex Trading Strategies
- Open a FREE Trading Account
Related Articles


Comments
Sidebar rates
Related Posts
