WTI Crude Oil (USOIL) Drops Below Key Support: Is $67.06 the Next Target?
Oil prices saw a modest rebound on Wednesday, recovering from two-month lows reached in the previous session...

Oil prices saw a modest rebound on Wednesday, recovering from two-month lows reached in the previous session.

This recovery was fueled by industry reports showing a 640,000-barrel drop in U.S. crude inventories for the week ending February 21, according to the American Petroleum Institute (API). If confirmed by the U.S. Energy Information Administration (EIA), this would mark the first decline in U.S. crude stockpiles since mid-January. Analysts had anticipated a 2.6-million-barrel increase, underscoring the market’s surprise and driving a short-term price recovery.
However, the rebound was limited by continued economic uncertainty. U.S. consumer confidence experienced its sharpest drop in three and a half years, accompanied by soaring 12-month inflation expectations. Similarly, Germany’s economy contracted in the last quarter of 2024, intensifying recession fears in Europe. These economic concerns have dampened demand prospects, capping gains in crude prices.
Supply Dynamics: Russian Sanctions and OPEC+ Strategy
The supply landscape is undergoing significant shifts. Optimism around a potential peace deal between Russia and Ukraine has raised speculation about the lifting of Russian sanctions, which could ease supply constraints. ING strategists noted that easing sanctions would remove a significant layer of supply uncertainty. Meanwhile, the U.S. and Ukraine are reportedly nearing a minerals deal, potentially accelerating the resolution of geopolitical tensions.
Despite this, fresh U.S. sanctions on Iran could offset any supply gains. ANZ Bank analysts noted that U.S. policies could lead to a reduction of up to 1 million barrels per day in Iranian crude exports. However, this loss may be counterbalanced by OPEC+ members planning to ramp up production in the coming months. Commodity Context analyst Rory Johnston highlighted that OPEC+ is likely to bring additional supply to the market, potentially stabilizing prices.
Technical Analysis: Bearish Momentum Below $70.09
WTI Crude Oil is currently trading at $69.06 after a sharp sell-off. The price broke below the critical support level at $70.09, which now acts as immediate resistance. The 50 EMA at $70.94 reinforces the bearish momentum, suggesting continued downward pressure. Should the sell-off persist, the next support levels are at $68.64 and $67.89, with a potential drop to $67.06 if bearish momentum intensifies.
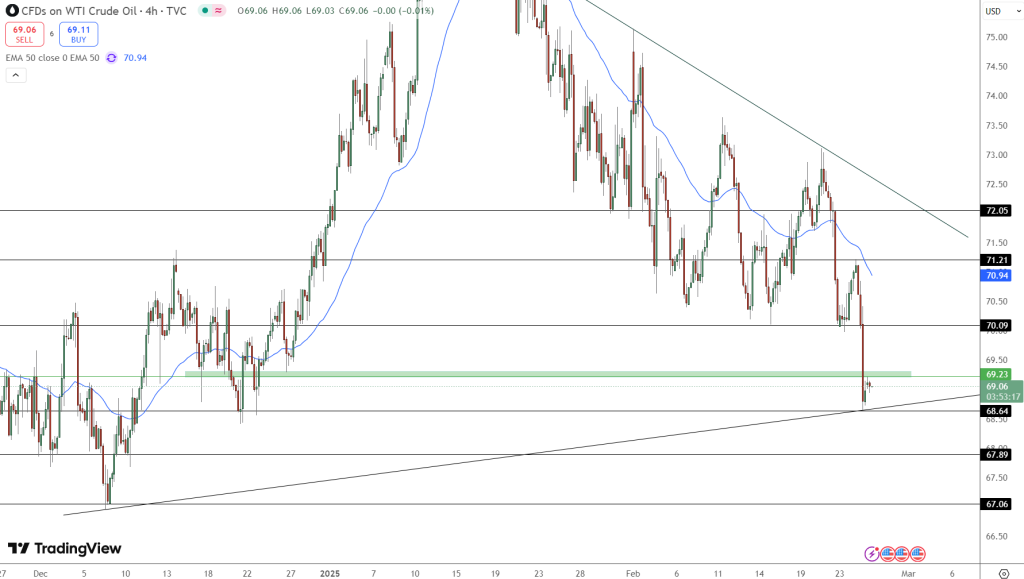
Price action indicates a retest of the broken support at $69.23, now acting as resistance. This level aligns with a previous demand zone that has turned into supply, confirming a bearish bias. A rejection from $69.23 could trigger accelerated selling towards $67.06. Conversely, a break above this resistance could lead to a retest of $70.09, but the overall sentiment remains bearish given the pattern of lower highs and lower lows.
Key Insights:
Bearish Momentum: Confirmed below $70.09, with immediate resistance at $69.23.
Next Support Levels: $68.64 and $67.89, with a potential drop to $67.06 if selling continues.
50 EMA Pressure: At $70.94, reinforcing short-term bearish sentiment.
USOIL Outlook: Bearish with Potential for Deeper Pullback
With the price firmly below the 50 EMA and key resistance at $70.09, the outlook for WTI Crude remains bearish. Traders should watch for volume confirmation and price action at $69.23 for short-selling opportunities. A decisive break below $68.64 could trigger a deeper pullback, targeting $67.06. Conversely, a move above $70.09 would invalidate the bearish scenario, possibly leading to a short-term rally.
- Check out our free forex signals
- Follow the top economic events on FX Leaders economic calendar
- Trade better, discover more Forex Trading Strategies
- Open a FREE Trading Account
Related Articles
Comments
Sidebar rates
Related Posts
