Dogecoin Technical Analysis Points to Potential 404% Surge to $1.11 by March 20
Dogecoin (DOGE), the original meme cryptocurrency, has experienced a significant downturn in February, dropping over 34% in the past month.
Live DOGE/USD Chart

Dogecoin (DOGE), the original meme cryptocurrency, has experienced a significant downturn in February, dropping over 34% in the past month. However, technical analysis and historical patterns suggest the popular cryptocurrency could be poised for a dramatic reversal in March, with some analysts predicting a surge that could potentially break the $1 barrier for the first time.
DOGE/USD Technical Analysis
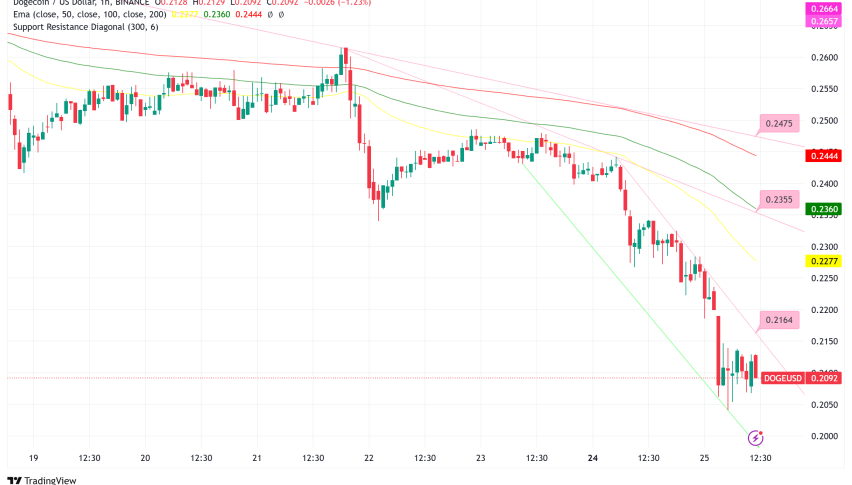
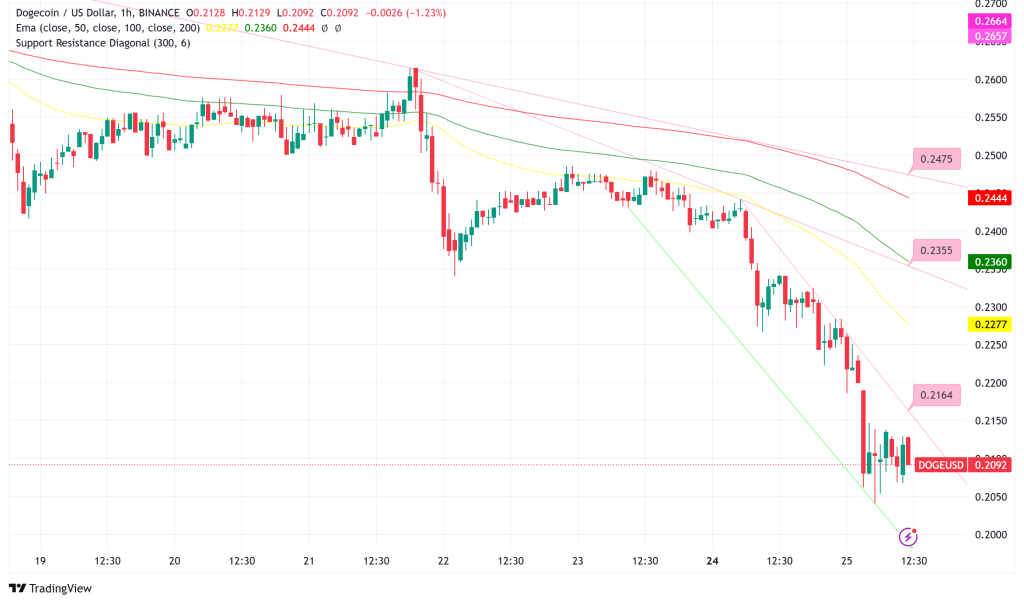
Dogecoin DOGE/USD is selling about $0.23 as of right now; it dropped almost 7% over 24 hours. With price movement below numerous important support levels like $0.265, $0.26, and $0.25 the cryptocurrency has developed a negative trend. DOGE has tested at $0.2052 and is presently stabilizing below the 100-hour simple moving average and the $0.2250 resistance line.
Technical indicators paint a challenging short-term picture:
- The MACD (Moving Average Convergence Divergence) is gaining momentum in the bearish zone
- The Relative Strength Index (RSI) remains below the 50 level, indicating continued selling pressure
- A connecting bearish trend line has formed with resistance at $0.2180 on the hourly chart
Network activity has also declined dramatically, reaching its lowest point since October 2024 with less than 60,000 active addresses daily and only 66 whale transactions, according to analyst Ali Martinez.
Key Levels to Watch
For traders watching Dogecoin’s price action, several critical levels bear monitoring:
Key Support Levels:
- $0.2065 (immediate support)
- $0.2050 (major support)
- $0.2000 (psychological threshold)
- $0.1880 and $0.1740 (potential targets if $0.20 breaks)
Key Resistance Levels:
- $0.2180 (immediate resistance with trend line)
- $0.2250 (major resistance)
- $0.2330 (50% Fibonacci retracement level)
- $0.2500 and $0.2620 (higher resistance zones)
Bybit Hack and Crypto Market’s Bearish Mood
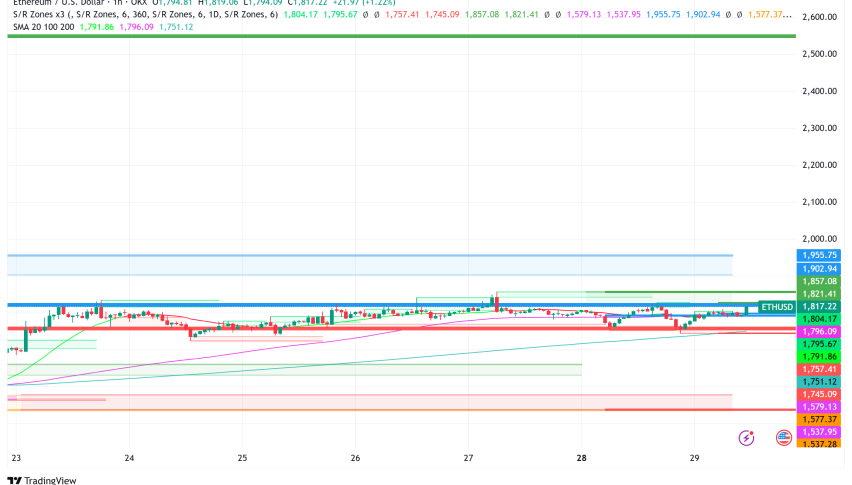
The latest $1.4 billion Bybit heist involving Ethereum-related cryptocurrencies has heightened the pessimistic attitude throughout the crypto market. Together with macroeconomic considerations such the Federal Reserve’s cautious approach to interest rate cuts, this security vulnerability has added to negative pressure on Dogecoin and the larger cryptocurrency market.
Dogecoin Price Prediction for March
Though February’s performance is not great, some analytical sites show shockingly positive predictions for Dogecoin in March:
- With a peak of $0.895 and a floor of $0.572, CoinCodex estimates DOGE might rise by 206.19% in March, possibly averaging $0.706.
- More drastically even, both CoinCodex and Changelly predict Dogecoin reaching $1.11 by March 20th, therefore reflecting a 404.5% rise from present levels.
Historical Patterns and the 50-Day Countdown
A compelling technical case for a Dogecoin rally emerges from historical patterns and cycle analysis. Current price action suggests DOGE is forming its fourth falling wedge pattern—a bullish formation that has previously triggered significant price increases:
- First wedge breakout: 88% gain
- Second wedge breakout: 208% increase
- Third wedge breakout: 445% surge
Additionally, a noteworthy cyclical relationship exists between Bitcoin halving events and Dogecoin price movements. In the previous market cycle, DOGE reached its all-time high exactly 362 days after Bitcoin’s halving. This cycle, that same landmark falls on April 16, 2025—just 50 days from now.
- Check out our free forex signals
- Follow the top economic events on FX Leaders economic calendar
- Trade better, discover more Forex Trading Strategies
- Open a FREE Trading Account
Related Articles

Comments
Sidebar rates
Related Posts
