Ethereum Plunges Under $2,500: Technical Analysis Reveals Critical $2,600 Level
Ethereum (ETH) continues to face downward pressure in the market, dropping under $2,500 as of the latest data, reflecting a significant 7.6%
Live ETH/USD Chart

Ethereum (ETH) continues to face downward pressure in the market, dropping under $2,500 as of the latest data, reflecting a significant 7.6% decline in 24 hours. This downward trend persists despite some analysts maintaining strong long-term bullish sentiment and notable market developments including a major exchange hack.

Impact of Bybit Hack Impact and Recovery on Ethereum Price
The recent Bybit exchange attack caused around $1.4 billion worth of digital assets to be stolen; Ethereum accounted for most of the lost money, therefore affecting the bitcoin market. Though first assumptions would have prices rising through open market purchases driven by Bybit’s attempts to retrieve the stolen ETH, the reverse occurred.
Ben Zhou, the bitwise CEO, verified that the attack comprised a transaction including harmful source code altering the smart contract logic of the wallet. Although the trade claimed to have closed the position totally and first claimed to have recovered over 50% of the stolen Ether, the expected price surge did not show up.
Most transactions, according to market observers, took place through over-the-counter (OTC) desks, which gave enough liquidity to meet demand without appreciably affecting market pricing. Given the combined 2% order book depth for ETH across the top 10 exchanges totals just approximately $52 million, this ran counter to trading predictions that the $700 million market buy would generate significant purchasing pressure.
One market analyst pointed out that “the Bybit hack itself highlighted risks associated with complex multisig setups using the Ethereum Virtual Machine,” therefore influencing investor attitude toward the Ethereum ecosystem. “The incident underlined the needless complication and lack of strong defense mechanisms relative to basic hardware wallets.”
ETH/USD Technical Analysis: Critical Support Levels
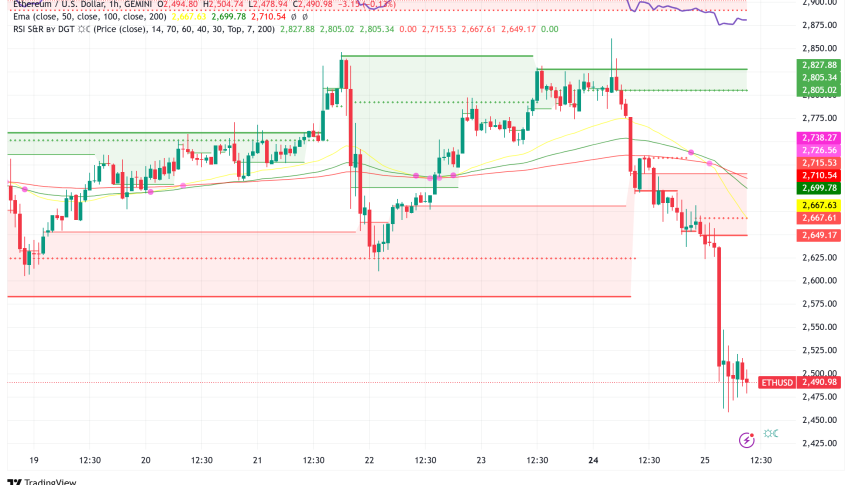
From the $2,850 resistance zone, Ethereum’s price has dropped fresh, finding difficulty keeping support over $2,500. Technical indications present a worrying temporary picture:
- ETH is trading below $2,750 and the 100-hourly Simple Moving Average
- A bearish trend line has formed with resistance at $2,600
- The MACD for ETH/USD is gaining momentum in the bearish zone
- RSI remains below the 50 zone
Emphasizing the crucial relevance of the $2,600 barrier, crypto researcher Ali Martinez cautioned that aspirations for a “altseason” could be essentially canceled should Ethereum drop below this level. First main support falls close to $2,450; if selling pressure rises, the second critical support comes at $2,120.
On the plus side, Ethereum encounters opposition almost at $2,550; main opposition forms about $2,650. A decisive rise above $2,650 might set off a rally above $2,750, with more momentum maybe driving the price to test the $2,850 resistance zone.
Ethereum’s Long-Term Outlook Remains Positive
Many analysts keep positive long-term forecasts for Ethereum despite temporary difficulties. One unidentified expert referred to as “Doctor Profit” published a thorough study stressing quite favorable ETH risk-reward ratios. Ethereum is only 18% above the 200-week EMA line, the historically correct technical indicator the expert pointed out that has constantly given support.
“Here the risk-reward is very exceptional! The possible worst case is just 20%; the rise towards 8-10k is approx 200%. Excellent, the analyst said, the risk reward ratio.
Several high-time frame settings support this optimistic thesis, including an ascending triangle pattern and a multi-year rising channel. Data from Glassnode shows higher accumulation activity near the $2,632 support level where 786,000 ETH has been bought. At $3,150 with 1.22 million ETH, an even more massive accumulation cluster forms.
Glassnode says “this trend suggests that investors are averaging down, accumulating ETH at lower prices rather than completely exiting positions.”
Ethereum reserves on cryptocurrency exchanges have apparently dropped to a nine-year low, therefore supporting the long-term optimistic scenario and maybe resulting in supply shortage that could propel future price increase.
Ethereum vs. Bitcoin Performance
Fascinatingly, under recent market situations Ethereum has shown relative durability against Bitcoin. Analyst “crypto sun-moon” said that whilst Bitcoin’s taker buy-sell ratio is falling, Ethereum’s is increasing. Historically, such a shift in dynamic has let Ether acquire short-term positive momentum against Bitcoin.
Particularly given ETH supply growth has reached 0.6% inflation, the Ethereum market is also battling with issues around the low 2.4% adjusted native staking yield. This is below Solana’s SOL adjusted native staking yield of 4%. Still, analysts are excited about the possible inclusion of staking in US spot Ether exchange-traded funds under investigation by the US Securities and Exchange Commission.
Investors and traders are keenly observing important support and resistance levels as Ethereum negotiates these intricate market dynamics, especially with regard to the crucial $2,600 threshold that can decide the direction of Ethereum and the larger altcoin market in the next weeks.
- Check out our free forex signals
- Follow the top economic events on FX Leaders economic calendar
- Trade better, discover more Forex Trading Strategies
- Open a FREE Trading Account
Related Articles
Comments
Sidebar rates
Related Posts
