S&P 500, Tesla Stock Continued to Decline on Confirmation of Reciprocal Tariffs
After some volatility, the S&P500 index and the tesla stock continued lower today, with tariff talk weighing on risk sentiment.
Live SP500 Chart

After some volatility, the S&P500 index and the tesla stock continued lower today, with tariff talk weighing on risk sentiment.
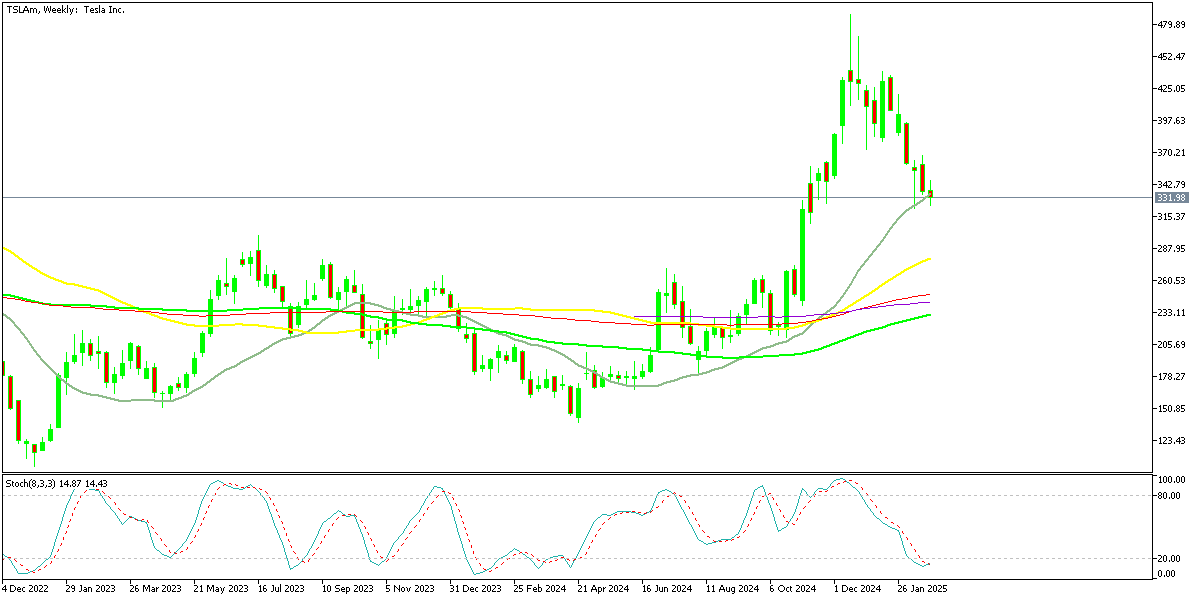
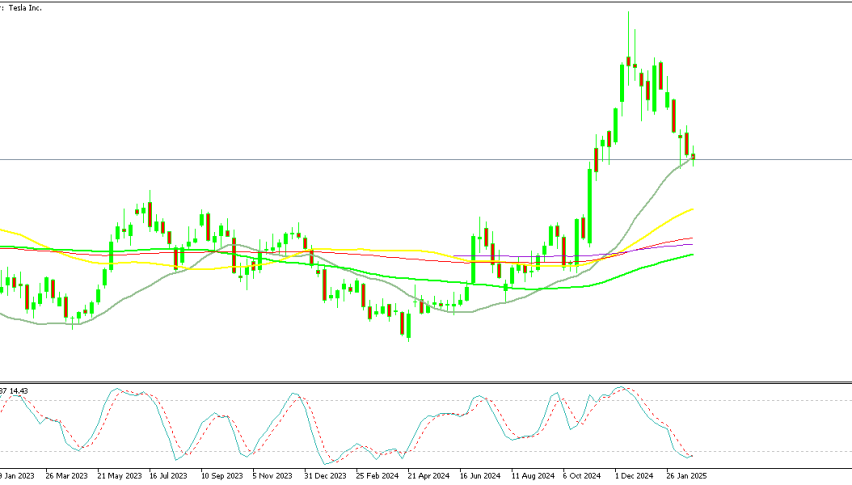
Tesla experienced a tremendous rally throughout 2023, surging over 200% in the fourth quarter alone. However, after reaching a peak of $488 in mid-December, the stock reversed direction, forming lower highs and beginning a downward trajectory. Since mid-December, Tesla has lost approximately 30% of its value, dipping to a low of $322 earlier this month.
Tesla’s Chart Daily – Struggle to Maintain Momentum

The 100-day SMA (green) provided key support, sparking a brief rebound, but resistance at the 20-day SMA (gray) pushed the stock lower once again. By the middle of last week, Tesla shares resumed their decline and, once again, retested the 100-day SMA today. The question remains whether sellers will break through this crucial support level or if buyers will step in to trigger another bounce.
Stock Market Volatility Driven by Economic and Geopolitical Factors
A relatively quiet economic calendar led to early losses in the stock market, causing major indices to give up their initial gains. At session lows, the S&P 500 fell by 35 points, while the Nasdaq dropped by 250 points. However, the market found brief relief as geopolitical developments provided a temporary boost.
Former President Donald Trump stated that the Russia-Ukraine conflict could come to an end within weeks, and Russian President Vladimir Putin acknowledged Trump’s diplomatic efforts to improve conditions for Ukraine. These remarks lifted investor sentiment momentarily, pushing stocks higher, but the rally quickly faded, leading to another bearish reversal by the close of trading.
Tariff Tensions Add to Market Uncertainty
During a press conference, Trump was asked about the status of tariffs on Canada and Mexico, which had been postponed until March 4. His response was firm: “The tariffs are going forward on time, on schedule, and we’re going to make up a lot of territory.” He also hinted at potential reciprocal tariffs in the near future, which added further unease to the markets. By the end of the trading session, the Dow managed to close in positive territory, while both the S&P 500 and Nasdaq remained in the red, reflecting ongoing investor concerns over trade policies and economic stability.
Closing Levels for Major US Indices
Dow Jones Industrial Average (DJIA)
- Closed at 43,461.21 points
- Gained +33.19 points (+0.076%)
- Showed slight resilience despite broader market declines
S&P 500 Index
- Ended the session at 5,983.25 points
- Declined by −29.88 points (-0.50%)
- Struggled under selling pressure, reflecting cautious sentiment
Nasdaq Composite Index
- Closed at 19,286.93 points
- Dropped −237.08 points (-1.21%)
- Led losses as technology stocks faced heavy selling
The Dow Jones managed to post a modest gain, supported by strength in select blue-chip stocks. However, the broader market remained under pressure, with the S&P 500 slipping and the Nasdaq experiencing a significant drop. Tech stocks bore the brunt of the sell-off, dragging the Nasdaq lower by more than 1%. The market’s weakness was attributed to renewed concerns over trade policies, geopolitical developments, and investor caution ahead of key economic data. The continued volatility suggests that traders remain uncertain about near-term market direction, with upcoming catalysts likely to dictate the next major moves in equities.
S&P 500 Live Chart
- Check out our free forex signals
- Follow the top economic events on FX Leaders economic calendar
- Trade better, discover more Forex Trading Strategies
- Open a FREE Trading Account
Related Articles


Comments
Sidebar rates
Related Posts
