Gold Price Today Reaches Another Record High – Looking to Buy XAU Pullbacks

We saw another all-time high in the Gold price today, with the price touching $2,956.18 while it remains supported by MAs, where we intend to buy XAU.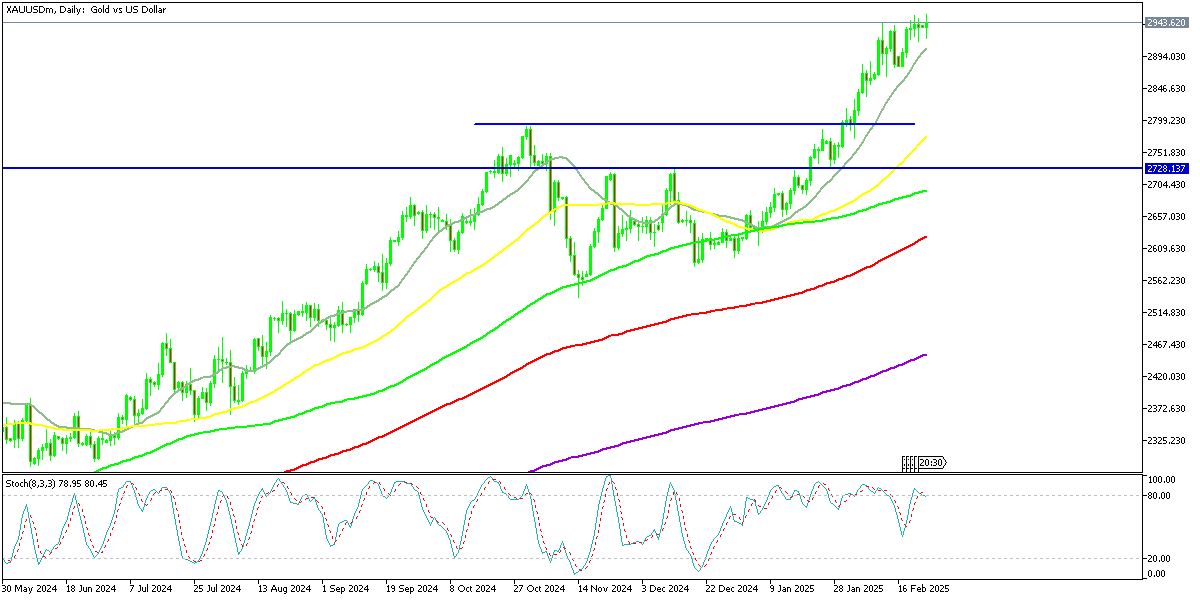
Gold has been on a massive rally for more than a year, surging from around $2,000 at the start of 2024, while now it is within reach of $3,000, as buyers keep pushing to new highs. So, it seems like Gold is just looking for any reason to rally, as we continue to see new highs when the risk sentiment is positive, as well as when the risk sentiment is negative in the financial market.
Gold prices continue their upward momentum, driven by heightened demand for safe-haven assets amid ongoing financial market instability and political uncertainty following the German election crisis. The precious metal surged to a high of $2,942 earlier in February before pulling back. However, key moving averages have provided support, preventing a deeper decline and maintaining the bullish trend.
| Broker | Review | Regulators | Min Deposit | Website | |
|---|---|---|---|---|---|
| 🥇 |  | Read Review | FCA, CySEC, ASIC, MAS, FSA, EFSA, DFSA, CFTC | USD 100 | Visit Broker |
| 🥈 | Read Review | FSCA, FSC, ASIC, CySEC, DFSA | USD 5 | Visit Broker | |
| 🥉 |  | Read Review | CySEC, MISA, FSCA | USD 25 | Visit Broker |
| 4 |  | Read Review | ASIC, BaFin, CMA, CySEC, DFSA, FCA, SCB | USD 200 | Visit Broker |
| 5 |  | Read Review | ASIC, FCA, CySEC, SCB | USD 100 | Visit Broker |
| 6 | Read Review | FCA, FSCA, FSC, CMA | USD 200 | Visit Broker | |
| 7 | Read Review | BVI FSC | USD 1 | Visit Broker | |
| 8 |  | Read Review | CBCS, CySEC, FCA, FSA, FSC, FSCA, CMA | USD 10 | Visit Broker |
| 9 |  | Read Review | ASIC, CySEC, FSCA, CMA | USD 100 | Visit Broker |
| 10 |  | Read Review | IFSC, FSCA, ASIC, CySEC | USD 1 | Visit Broker |
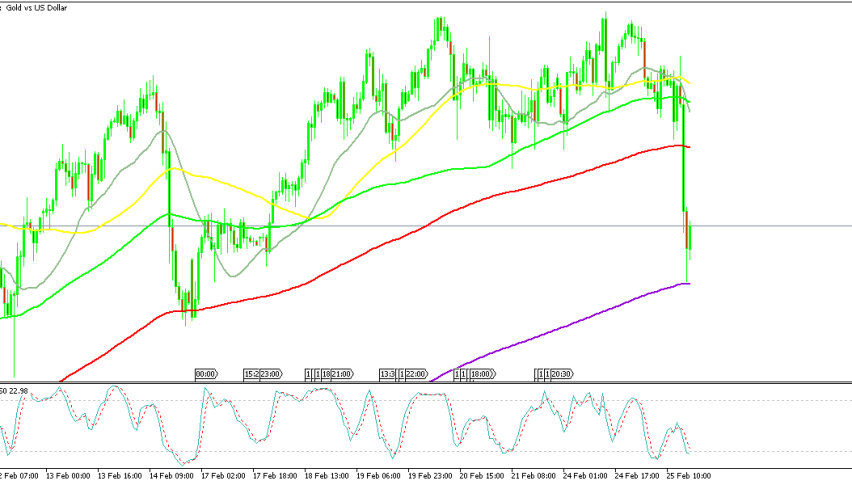
Gold Chart H4 – MAs Continue to Push the Lows Higher

On the H4 chart, gold remains well-supported by the 20-SMA and 50-SMA, with buyers consistently stepping in at these levels. This pattern of sustaining higher lows signals that bullish sentiment remains strong. Last week, gold nearly touched $2,955, reinforcing the prevailing upward pressure. Although the price dipped slightly to $2,916, the retracement was short-lived as support was found at the 50-day simple moving average, halting further losses.
The swift rebound from this support level indicates renewed buying interest, suggesting that investors are still optimistic about further gains. If market conditions remain favorable, gold’s trajectory is expected to remain bullish. With this in mind, we are looking for an opportunity to enter a buy position on another pullback to the moving averages, as the technical setup continues to point towards further price increases.
Gold Live Chart

Sidebar rates
Add 3442

Related Posts
Add 3440