


WTI Crude Oil Prices Drop Amid Rising U.S. Inventories: What’s Next?
WTI Crude Oil prices continued their downward trend as U.S. crude inventories surged for the fourth consecutive week.

According to the American Petroleum Institute, U.S. crude stocks rose by 3.34 million barrels for the week ending February 14, surpassing analysts’ expectations of a 2.2 million barrel increase. This surge signals a decrease in demand, causing West Texas Intermediate crude to dip by 0.5% to $71.91 per barrel, while Brent crude edged 0.1% lower to $75.96 per barrel.
| Broker | Review | Regulators | Min Deposit | Website | |
| 🥇 |  | Read Review | ASIC, FSA, CBI, BVI, FSCA, FRSA, CySEC, ISA, JFSA | USD 100 | Visit Broker >> |
| 🥈 | Read Review | FMA, FSA | USD 50 | Visit Broker >> | |
| 🥉 |  | Read Review | FSCA, CySEC, DFSA, FSA, CMA | USD 0 | Visit Broker >> |
| 4 |  | Read Review | SFSA, FSCA, CySec* | USD 5 | Visit Broker >> |
| 5 | Visit Broker >> | Read Review | FCA, CySEC, FSCA, SCB | USD 100 | Visit Broker >> |
| 6 |  | Read Review | FCA, FINMA, FSA, ASIC | USD 0 | Visit Broker >> |
| 7 |  | Read Review | CySEC, FCA, FSA, FSCA, Labuan FSA | USD 100 | Visit Broker >> |
| 8 |  | Read Review | Not Regulated | 0.001 BTC | Visit Broker >> |
| 9 |  | Read Review | ASIC, CySEC, FSCA, CMA | USD 100 | Visit Broker >> |
| 10 |  | Read Review | SVGFSA | USD 5 | Visit Broker >> |
The Energy Information Administration’s (EIA) official report, due later today, could further influence market sentiment. If the EIA confirms the inventory build-up, it will mark the first four-week increase since April, adding pressure to crude prices.
Technical Analysis: Downward Channel Continues
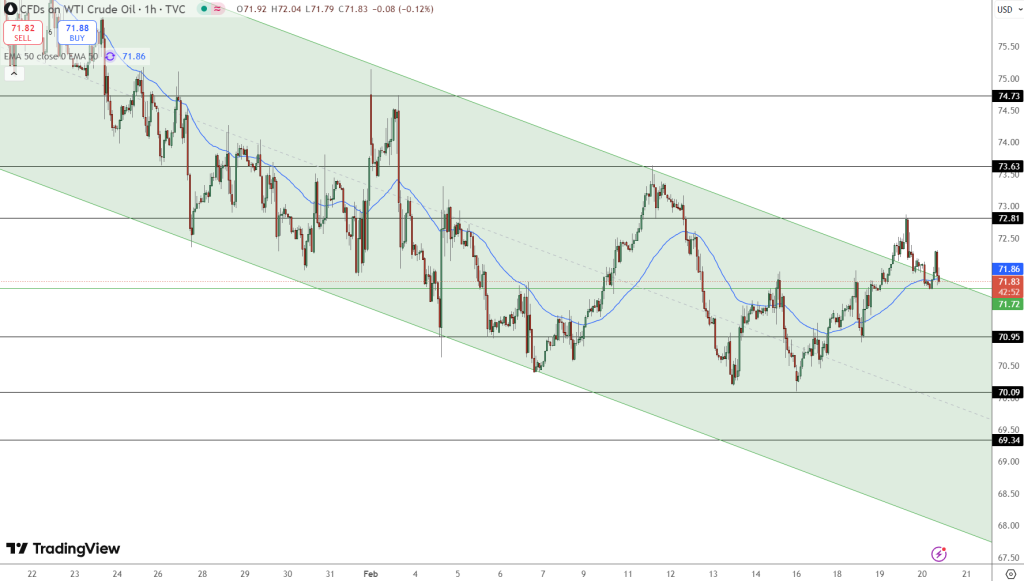
The WTI Crude Oil chart on the 1-hour timeframe illustrates a pronounced downward channel, with prices consistently respecting the upper and lower trendlines. The 50-period Exponential Moving Average (EMA) acts as a dynamic resistance, keeping prices below the $71.86 level.
Recent price action shows a rejection at the $72.81 resistance level, indicating a bearish continuation within the channel. Key support levels are as follows:
$70.95: Immediate support level
$70.09: Stronger floor, which could trigger selling pressure if breached
$69.34: Bearish target if the downward momentum persists
Conversely, a breakout above the $72.81 resistance level and the upper trendline could signal a bullish reversal. However, the current bearish sentiment, coupled with rising inventories, favors continued downside pressure.
Market Outlook: What to Watch Next
Several factors could influence the next move in WTI Crude Oil prices:
EIA Inventory Report: Confirmation of a fourth consecutive inventory build could reinforce bearish sentiment.
Economic Data: Upcoming U.S. economic data releases, including unemployment claims and manufacturing indices, could sway market direction.
Global Trade Dynamics: Ongoing trade tensions and tariffs on key commodities, including cars and semiconductors, may impact global demand for crude oil.
Key Takeaways for Traders:
Monitor the $70.95 and $70.09 support levels closely.
A break below $70.09 could accelerate bearish momentum toward $69.34.
A breakout above $72.81 would challenge the bearish outlook, potentially leading to a trend reversal.
With inventories rising and technical indicators pointing to continued bearish pressure, traders should remain cautious. Upcoming economic reports and geopolitical developments will be pivotal in shaping the short-term outlook for WTI Crude Oil prices.


Add 3442

Related Posts
Add 3440

🏆 7 Best Forex Brokers
| Broker | Website | |
|---|---|---|
| 🥇 |  | Visit Broker |
| 🥈 |  | Visit Broker |
| 🥉 |  | Visit Broker |
| 4 |  | Visit Broker |
| 5 |  | Visit Broker |
| 6 | Visit Broker | |
| 7 | Visit Broker |
