Gold Hits $2,942: Will the Bull Run Continue?

Gold (XAU/USD) has reached a new all-time high of $2,942.70, surpassing its previous record of $2,911.30.

This marks the eighth record high in 2025, as investors turn to the safe-haven asset amid increasing economic uncertainty. Gold has been on an upward trend for 16 months, rallying 63% since its October 2023 low of $1,809.50. The rally accelerated after Trump’s re-election in November 2024, with the metal gaining 16% from $2,536.71 as trade tensions escalated.
| Broker | Review | Regulators | Min Deposit | Website | |
|---|---|---|---|---|---|
| 🥇 |  | Read Review | FCA, CySEC, ASIC, MAS, FSA, EFSA, DFSA, CFTC | USD 100 | Visit Broker |
| 🥈 | Read Review | FSCA, FSC, ASIC, CySEC, DFSA | USD 5 | Visit Broker | |
| 🥉 |  | Read Review | CySEC, MISA, FSCA | USD 25 | Visit Broker |
| 4 |  | Read Review | ASIC, BaFin, CMA, CySEC, DFSA, FCA, SCB | USD 200 | Visit Broker |
| 5 |  | Read Review | ASIC, FCA, CySEC, SCB | USD 100 | Visit Broker |
| 6 | Read Review | FCA, FSCA, FSC, CMA | USD 200 | Visit Broker | |
| 7 | Read Review | BVI FSC | USD 1 | Visit Broker | |
| 8 |  | Read Review | CBCS, CySEC, FCA, FSA, FSC, FSCA, CMA | USD 10 | Visit Broker |
| 9 |  | Read Review | ASIC, CySEC, FSCA, CMA | USD 100 | Visit Broker |
| 10 |  | Read Review | IFSC, FSCA, ASIC, CySEC | USD 1 | Visit Broker |
The surge is driven by fears of a global trade war following the U.S. decision to impose a 25% tariff on aluminum and steel imports. Additionally, a 10% blanket tariff on Chinese imports and potential 25% duties on cars, chips, and pharmaceuticals have fueled concerns over inflation and slowed economic growth. This uncertainty has led to increased gold demand, with ETF inflows rising by 1.3%, pushing SPDR Gold Trust holdings to 27.92 million ounces.
Three Key Drivers of Gold’s Bull Market
Gold’s long-term price movement is historically driven by three major factors:
Consumer Demand in China and India: The two countries accounted for 53% of global gold demand in 2024, with China’s consumption at 815.5 metric tons and India at 802.8 metric tons. While China’s demand fell 10% YoY, India saw a 5% increase.
Central Bank Buying: Governments purchased 1,044.6 tons of gold in 2024, marking the third consecutive year above 1,000 tons. This trend highlights a shift away from U.S. Treasuries amid concerns over America’s economic policies.
Investment & Safe-Haven Demand: The growing ETF inflows and gold’s role as an inflation hedge suggest investors are preparing for heightened volatility due to unpredictable U.S. policies.
Gold Price Forecast: Next Targets & Key Levels
Gold is currently trading at $2,920.95, with bullish momentum following a strong bounce from support at $2,890.44. The 50-day EMA at $2,905.61 is providing a strong dynamic support level, keeping gold’s uptrend intact.
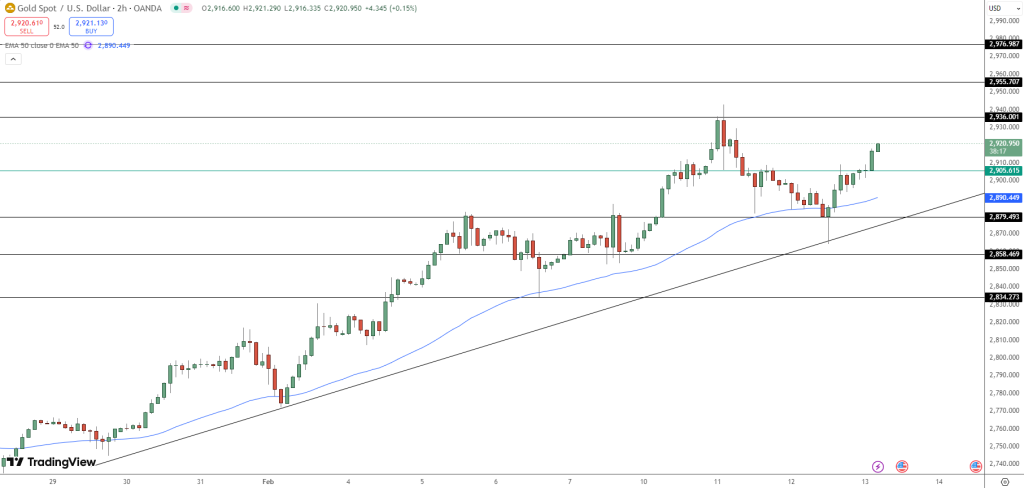
Resistance Levels to Watch:
$2,936.01 – Next key upside target.
$2,955.70 – Strong psychological level.
$2,976.98 – Potential breakout level.
Support Levels to Monitor:
$2,905.61 – Immediate support.
$2,890.44 – Critical trendline support.
$2,879.49 – Bearish breakdown zone.
The pivot point at $2,910 will determine gold’s short-term direction. A break above $2,936 could trigger another rally, while failure to hold $2,905 may lead to a retest of lower support zones. Investors should watch for increased trading volume and market sentiment to confirm the next move.


Add 3442

Related Posts
Add 3440