Oil Prices Fall $2 After EIA Buildup, Natural Gas Prices Keep Increasing
Crude Oil prices have reversed and slipped $1 lower, with WTI trading at $72 as EIA crude inventories jump, while natural gas is bullish.

Live WTI/USD Chart
[[WTI/USD-graph]]
Crude Oil prices have reversed and slipped $1 lower, with WTI trading at $72 as EIA crude inventories jump, while natural gas remains bullish.

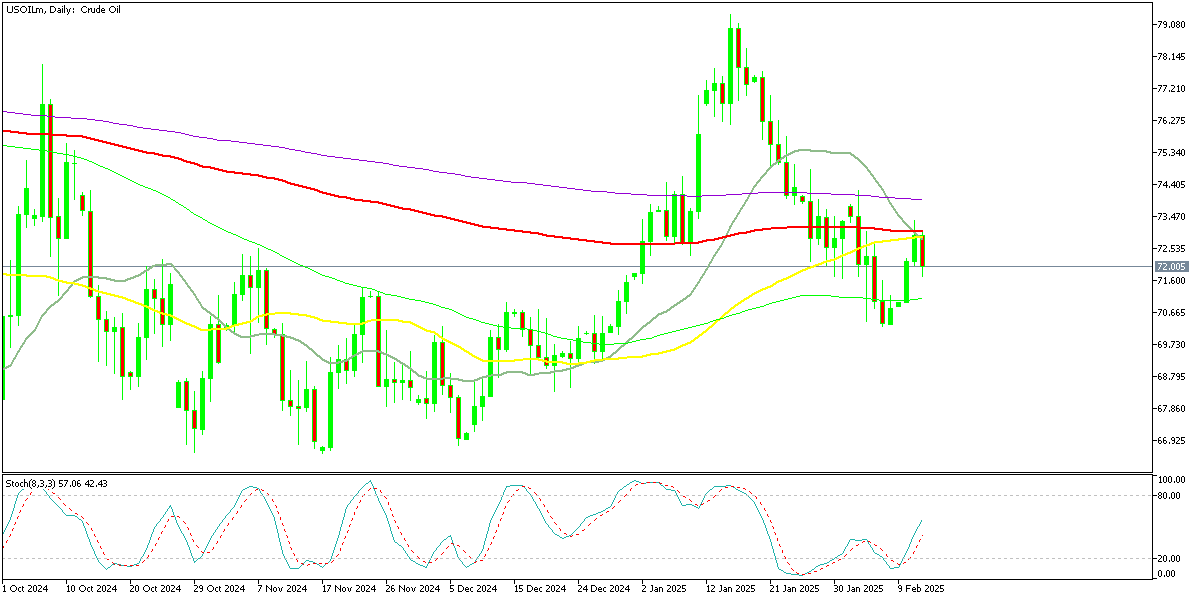
WTI Oil turned quite bullish in late December and early January, surging more than $10, from below $70 to almost $80, but returned lower to low $70s last week as the sentiment turned negative. This week buyers returned and WTI jumped to $73.36 but moving averages turned into resistance and rejected the price today, with the EIA inventories helping as well.
WTI Crude Oil Chart Daily – Rejected by MAs
The latest EIA crude oil inventory report revealed a larger-than-expected buildup in crude stocks, while gasoline inventories saw an unexpected drawdown, highlighting mixed supply and demand dynamics in the oil market.
Weekly EIA Crude Oil Inventory Data
Crude & Refined Product Inventory Changes
- Crude oil inventories increased by 4.070M barrels, surpassing the 3.028M barrel estimate but significantly lower than last week’s 8.664M barrel build.
- Gasoline inventories unexpectedly fell by 3.035M barrels, in contrast to forecasts of a 1.403M barrel increase, indicating stronger demand or lower refinery output.
- Distillate inventories rose slightly by 0.135M barrels, whereas analysts had anticipated a 1.539M barrel drawdown.
- Cushing storage saw a build of 0.872M barrels, reversing last week’s minor 0.034M barrel drawdown.
Refining & Production Trends
- Refinery utilization increased by 0.5%, aligning with expectations but lower than the previous week’s 1.0% gain.
- Crude oil production edged up by just 0.12%, slowing significantly from last week’s 1.8% surge, suggesting a moderation in supply growth.
The larger-than-expected crude buildup adds to concerns about excess supply, which could weigh on oil prices in the near term. However, the unexpected gasoline drawdown signals resilient consumer demand, potentially providing support to fuel prices. The modest refinery utilization increase suggests that refiners may be holding back output growth, while the small rise in crude production indicates that US output is stabilizing after a sharp jump last week. Overall, this mixed inventory report presents a neutral-to-bearish outlook for crude oil in the short term, with market focus shifting to upcoming OPEC+ supply decisions and global demand trends to determine price direction.
Natural Gas Chart Daily – Continues to Make Higher Lows
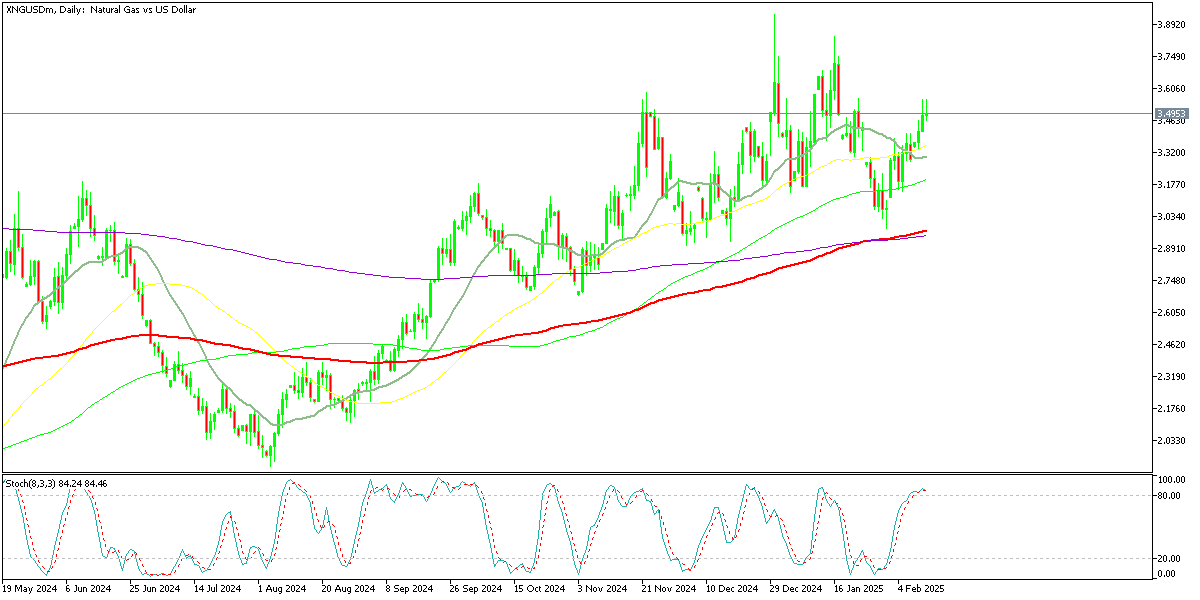
Natural gas on the other hand, has been quite bullish since August, when it dipped below $2. Since then, Gas price have been increasing, making constant higher highs, while finding support and buyers during pullbacks lower. In January we saw a $1 pullback, from $3,90 to around $3, but buyers came right back and Oil prices have increased again, trading around $3.50, indicating strong buying momentum, which will likely continue for February as well.
US WI Crude Oil Live Chart
- Check out our free forex signals
- Follow the top economic events on FX Leaders economic calendar
- Trade better, discover more Forex Trading Strategies
- Open a FREE Trading Account
Related Articles
Comments
Sidebar rates
Related Posts
