Oil Prices Pop Off as Russia’s Supply Dips & Tariffs Shake Markets
WTI crude oil prices continued to climb on Tuesday, driven by reports of declining Russian oil production and heightened concerns over additional supply disruptions.

After three consecutive weekly losses, both major oil benchmarks rebounded, gaining nearly 2% in the previous session as supply constraints tightened global markets.
| Broker | Review | Regulators | Min Deposit | Website | |
|---|---|---|---|---|---|
| 🥇 |  | Read Review | FCA, CySEC, ASIC, MAS, FSA, EFSA, DFSA, CFTC | USD 100 | Visit Broker |
| 🥈 | Read Review | FSCA, FSC, ASIC, CySEC, DFSA | USD 5 | Visit Broker | |
| 🥉 |  | Read Review | CySEC, MISA, FSCA | USD 25 | Visit Broker |
| 4 |  | Read Review | ASIC, BaFin, CMA, CySEC, DFSA, FCA, SCB | USD 200 | Visit Broker |
| 5 |  | Read Review | ASIC, FCA, CySEC, SCB | USD 100 | Visit Broker |
| 6 | Read Review | FCA, FSCA, FSC, CMA | USD 200 | Visit Broker | |
| 7 | Read Review | BVI FSC | USD 1 | Visit Broker | |
| 8 |  | Read Review | CBCS, CySEC, FCA, FSA, FSC, FSCA, CMA | USD 10 | Visit Broker |
| 9 |  | Read Review | ASIC, CySEC, FSCA, CMA | USD 100 | Visit Broker |
| 10 |  | Read Review | IFSC, FSCA, ASIC, CySEC | USD 1 | Visit Broker |
According to analysts at ANZ, Russian oil production in January fell below its OPEC+ quota, with output declining to 8.96 million barrels per day (bpd)—16,000 bpd below its approved level under the production agreement. This unexpected shortfall has eased fears of oversupply and shifted sentiment toward a more bullish outlook for crude prices.
Additionally, the U.S. sanctions on Russia’s oil shipping networks have disrupted exports to major buyers like China and India, further constraining supply. A recent Politico report suggested that European nations plan to seize Russia’s shadow fleet, intensifying concerns over global oil transportation.
Trump’s Trade Tariffs Cloud Demand Outlook
Despite the recent surge in oil prices, concerns over global demand persist as U.S. President Donald Trump announced new tariffs on steel and aluminum imports. The move raises trade tensions and increases uncertainty in energy markets. The tariff hike—set at 25% with no exceptions—will impact major exporters, including Canada, Mexico, Brazil, and South Korea.
In retaliation, China imposed a 10% tariff on U.S. crude oil imports, further dampening sentiment. Analysts warn that escalating trade disputes could curb global economic growth and weaken oil demand, particularly in industrial and manufacturing sectors.
Meanwhile, the U.S. Federal Reserve is expected to delay interest rate cuts until next quarter, according to a Reuters poll. Concerns over persistent inflation—exacerbated by Trump’s trade policies—are keeping borrowing costs elevated. A higher interest rate environment typically slows economic activity, which could weigh on crude demand.
Technical Outlook: WTI Eyes Key Breakout Levels
WTI crude oil (USOIL) is currently trading at $72.54, up 0.11%, as it approaches a critical resistance zone at $73.11. The price has successfully broken above the 50-day Exponential Moving Average (EMA) at $71.77, indicating a potential shift in market sentiment.
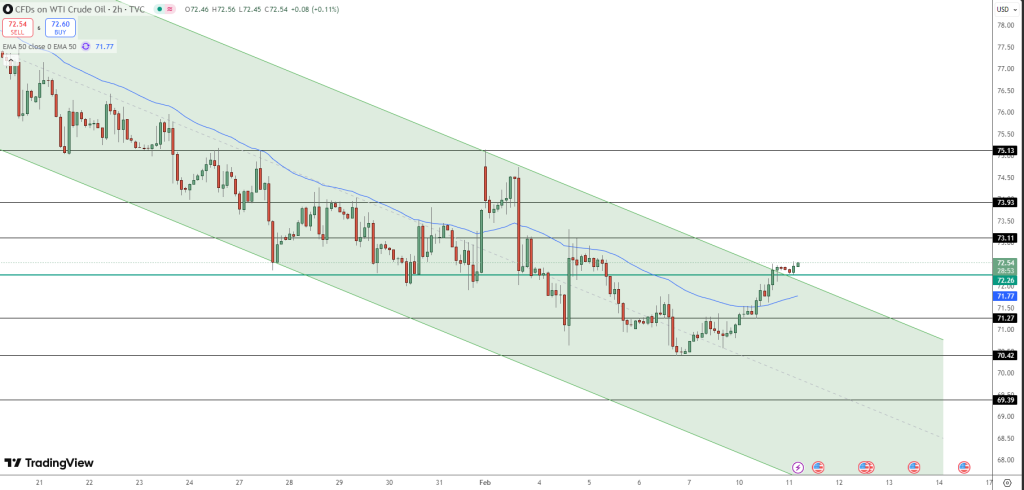
Immediate resistance: $73.11 – A confirmed breakout could push WTI toward $73.93 and $75.13, reinforcing a bullish trend.
Key support levels: $71.27 and $70.42 – A reversal below these points could trigger renewed selling pressure, with further downside risk.
Descending channel breakout: The recent price action suggests that WTI is attempting to exit its prolonged bearish channel. A sustained close above $73.11 could validate a trend reversal.
For now, traders should monitor market reactions to U.S. tariff policies, supply disruptions, and Federal Reserve updates as key drivers of price action.


Add 3442

Related Posts
Add 3440