GameStop (GME) Primed for Bullish Rebound or More Downside Ahead?

GameStop (GME) has been in a corrective phase for the past four weeks, retracing from its recent highs. Currently, GME is approaching key support levels, suggesting a potential for a bullish rebound. However, with the stock trending lower and testing critical technical thresholds, the question remains: will GME stock find support and bounce, or is there further downside ahead?
GameStop (GME) Approaches Key Support Levels After Four-Week Retracement
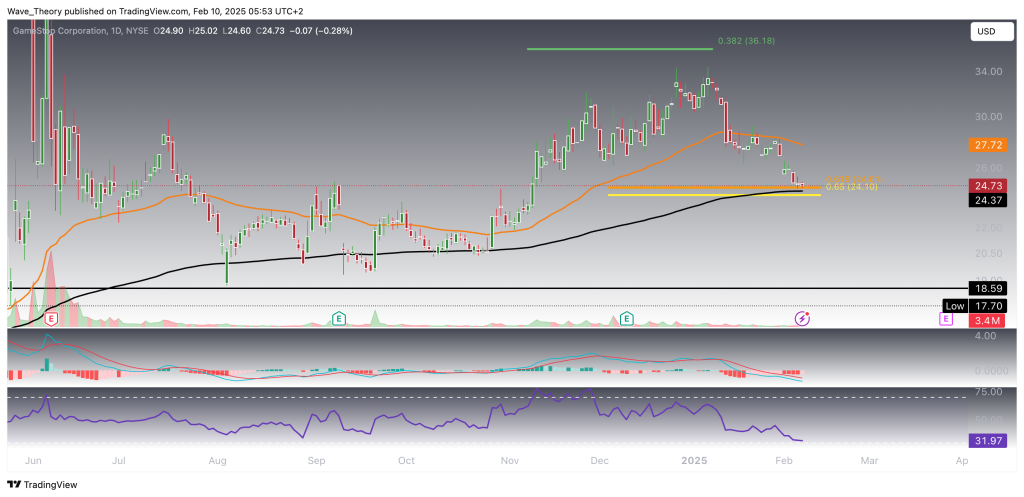
GameStop (GME) has now reached significant support at the golden ratio and the 200-day EMA at $24.40 after experiencing a four-week retracement. This support level could serve as a potential springboard for a bullish rebound, with a target set for the 50-day EMA at $27.72. However, the technical indicators on the daily chart present a mix of signals that traders should be mindful of.
Key Technical Indicators (Daily Chart):
- MACD: The MACD lines are currently bearishly crossed, but the histogram is beginning to tick bullishly higher, indicating the possibility of a trend reversal.
- RSI: The RSI is neutral but nearing oversold territory, which suggests the potential for a bounce.
- EMAs: The EMAs remain bullishly crossed, confirming the bullish trend in the short to medium term, despite recent downward pressure.
A break below the $24.10 support level could signal further downside, while a successful bounce would validate a bullish outlook.
On the 4-hour chart, GameStop (GME) displays a golden crossover in the EMAs, confirming a bullish trend in the short term. However, this could quickly reverse into a death cross if GME’s price breaks through the key golden ratio support at $24. A break of this support level could invalidate the bullish momentum and signal further downside.
On the other hand, if GME manages to bounce off this support level, it could target the next significant Fibonacci resistances at $28.3 and $31. Breaking above $31 would invalidate the ongoing correction and place GME back in its uptrend. The RSI has reached oversold regions, suggesting a potential reversal, while the MACD histogram is ticking bullishly higher, despite the MACD lines remaining bearishly crossed.
The combination of these signals suggests mixed prospects for GME, with the price direction hinging on the $24 support level.

GameStop
Will GameStop (GME) Face Further Downside?
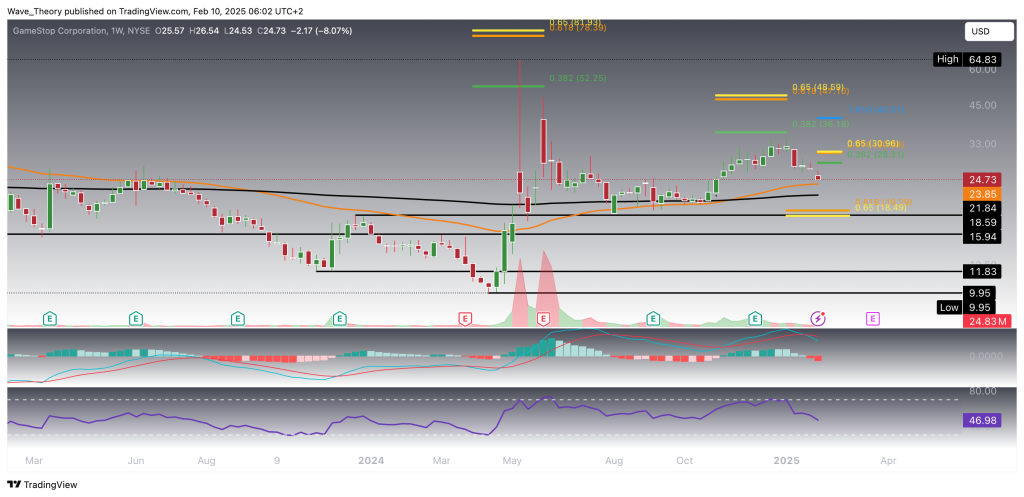
On the weekly chart, the MACD histogram has been trending bearishly for the past six weeks, with the MACD lines crossed bearishly, indicating increasing downward pressure. The RSI is neutral, not signaling immediate oversold or overbought conditions. However, the EMAs still maintain a golden crossover, confirming a bullish trend in the midterm.
If GameStop (GME) breaks below the key support level at approximately $24, it could extend its retracement down to the next golden ratio support at $18.5. Additionally, there is substantial support between the $16 and $18.6 range, which could act as a potential safety net for the price.
Summary
- Check out our free forex signals
- Follow the top economic events on FX Leaders economic calendar
- Trade better, discover more Forex Trading Strategies
- Open a FREE Trading Account
Related Articles


Comments
Sidebar rates
Related Posts
