S&P 500 Streaks Higher, But NFP Could Shake Things Up—What’s Next?
The S&P 500 rose 0.3%, the Nasdaq Composite gained 0.5% and the Dow Jones Industrial Average fell 125 points (-0.30%) as investors...

The S&P 500 rose 0.3%, the Nasdaq Composite gained 0.5% and the Dow Jones Industrial Average fell 125 points (-0.30%) as investors wait for Friday’s U.S. Non-Farm Payrolls (NFP) report.
Weekly jobless claims rose to 219,000, above expectations of 214,000, indicating a slight slowdown in the labor market. Although private payrolls grew in January, job openings saw the biggest drop in 14 months, casting doubt on the Fed’s rate-cut timeline. Many now think the Fed won’t cut rates until at least June 2025 if labor data holds up.
Tech Stocks Under Pressure as AI Costs Rise
Big Tech stocks are under pressure over artificial intelligence (AI) investments as Amazon (NASDAQ: AMZN) is about to report earnings after market close. Investors want to know Amazon’s AI plans especially after Alphabet (NASDAQ: GOOG) warned on capital expenditure and its stock got sold off. Meanwhile Eli Lilly (NYSE: LLY) rose 3% on strong demand for its obesity drug Zepbound and Yum! Brands (NYSE: YUM) surged 9% on Taco Bell sales growth. Ford (NYSE: F) fell 7% on weak profit guidance and uncertainty over U.S.-Canada-Mexico trade talks.
Chip Stocks Plunge Amid Apple Demand ConcernsSemiconductor stocks fell, Qualcomm (NASDAQ: QCOM) down 3% after poor patent licensing guidance following the expiration of its Huawei contract. Arm Holdings (NASDAQ: ARM) fell 3% as investors adjust expectations for AI-driven revenue growth.
The biggest decline was from Skyworks Solutions (NASDAQ: SWKS) which plunged 24% after warning on weaker demand from Apple (NASDAQ: AAPL) for iPhone 17 components. Now investors are looking at Friday’s NFP report which is expected to show 169,000 new jobs, down from 256,000 in December.
A weaker number could lead to rate cuts later this year, while a stronger report could reinforce the higher-for-longer rate stance, keeping markets volatile.
S&P 500 Technical Analysis – February 7, 2025
The S&P 500 (SPX) is at 6,083.56, up 0.36%, still trending higher as sentiment remains strong. The pivot at 6,057.69 is key—if above this, it’s bullish, with immediate resistance at 6,127.64, then 6,171.70 and 6,219.27. If buying continues, the index could move higher, confirming the bullish view.
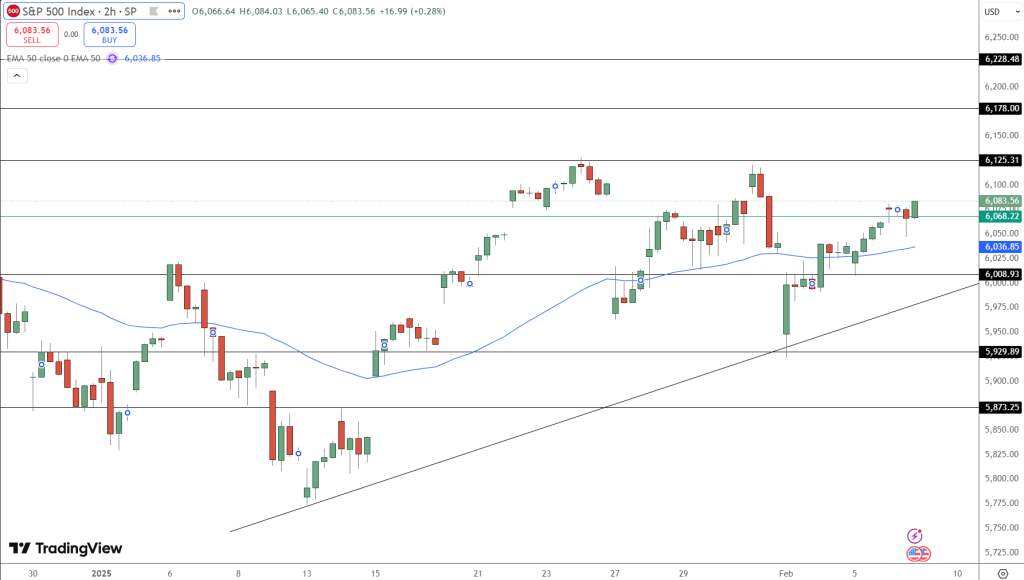
On the downside, 6,013.62 is the first support, then 5,969.55 and 5,904.50. If it breaks below these, it’s weak and could trigger a short-term correction. But buying near the pivot suggests equities are still strong.
The 50-day EMA at 6,057.18 is the key support level, confirming the uptrend. As long as the index is above this, the bull is in charge. A close below it could mean loss of momentum and 6,013.62 is the next support zone.
- Check out our free forex signals
- Follow the top economic events on FX Leaders economic calendar
- Trade better, discover more Forex Trading Strategies
- Open a FREE Trading Account
Related Articles


Comments
Sidebar rates
Related Posts
