The Selloff in BTC, ETH and XRP Resumes, Will It End Soon?

Cryptocurrencies continue to display weakness in 2025, with Bitcoin, Ethereum and Ripple prices resuming the decline today after a failed attempt to reverse higher earlier in the day.
Ripple (XRP) has experienced its worst weekly decline, shedding around 30% from its recent peak. However, this sharp drop could present an opportunity for investors who missed out on the last major rally or those looking to expand their positions.
Ripple saw a massive surge, climbing from $0.50 to $2.90 in November. The bullish momentum was driven by positive legal developments in Ripple’s case against the SEC and Donald Trump’s election victory, which fueled optimism across the crypto market. IN January it was followed by another rally in January that pushed the price to an all-time high of $3.38
Ripple Chart Daily – The 50 SMA Turned Into Resistance
However, XRP has been in a steep decline over the past three weeks, a downtrend that accelerated after Monday’s flash crash. The selloff sent XRP/USD down to $1.76 on Monday, where it found temporary support just above the 20-week SMA where it rebounded from. However, the bearish momentum resumed and XRP/USD has been declining for three days to $2.30. We’re waiting to buy Ripple at $2.
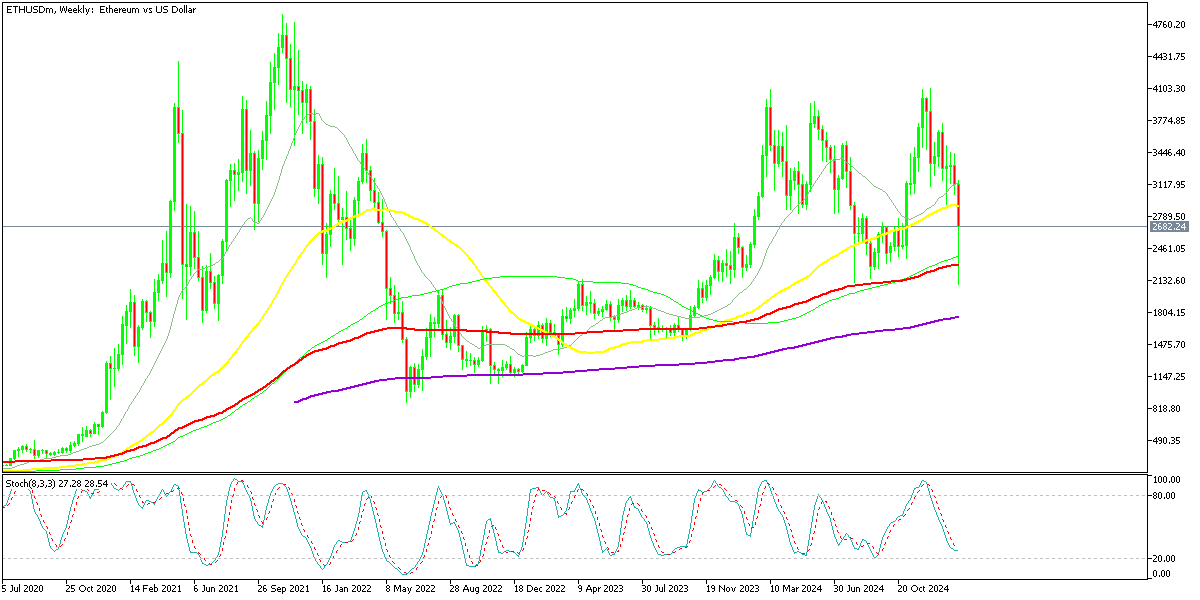
Ethereum has also shown weakness, as it failed to reach a new record high in late 2024, as most major cap cryptocurrencies did. ETH/USD barely reached $4,000 which is a strong resistance zone, but couldn’t hold the gains up there, with sellers taking over. Ethereum lost 50% of the value during the flash crash on Monday as the price tumbled to $2,000 lows. A bounce followed in the US session that day, but the selling picked up again. However, as long as moving averages continue to hold, the trend remains bullish, so we will try to buy ETH tokens closer to $2,000.
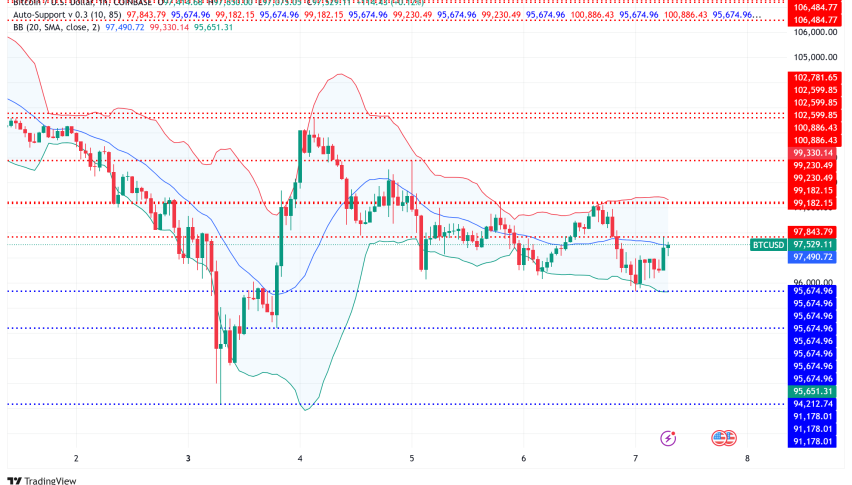
Bitcoin Chart Daily – The Support at $90K Still Holding 
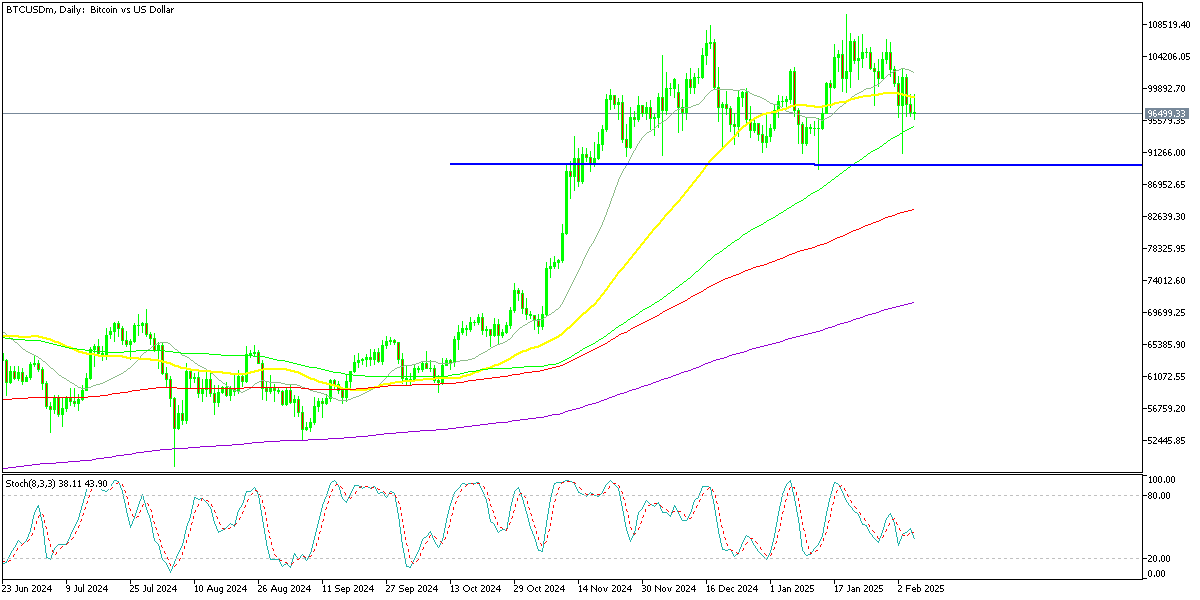
Bitcoin has shown more stability than the other two major cryptocurrencies. BTC placed a record high above $100K toward the end of 2024 and extended that to $109,870 in January. But, sellers seem reluctant to push the price too far up from the $100K level. The opposite is also true, BTC sellers also seem reluctant to push the price too far below $100K. A Strong support zone has formed above the $90k level, which seems like a good place to go long.
Bitcoin Live Chart