Palantir (PLTR) Stock Skyrockets, Set to Reach 20x from 2022 Low
Konstantin Kaiser•Tuesday, January 28, 2025•2 min read
Palantir (PLTR) stock continues to exhibit strong upward momentum, raising the question: How far can this rally go before encountering a significant pullback?
Palantir (PLTR) Has Surged By Over 1,332 % Since 2022-Low
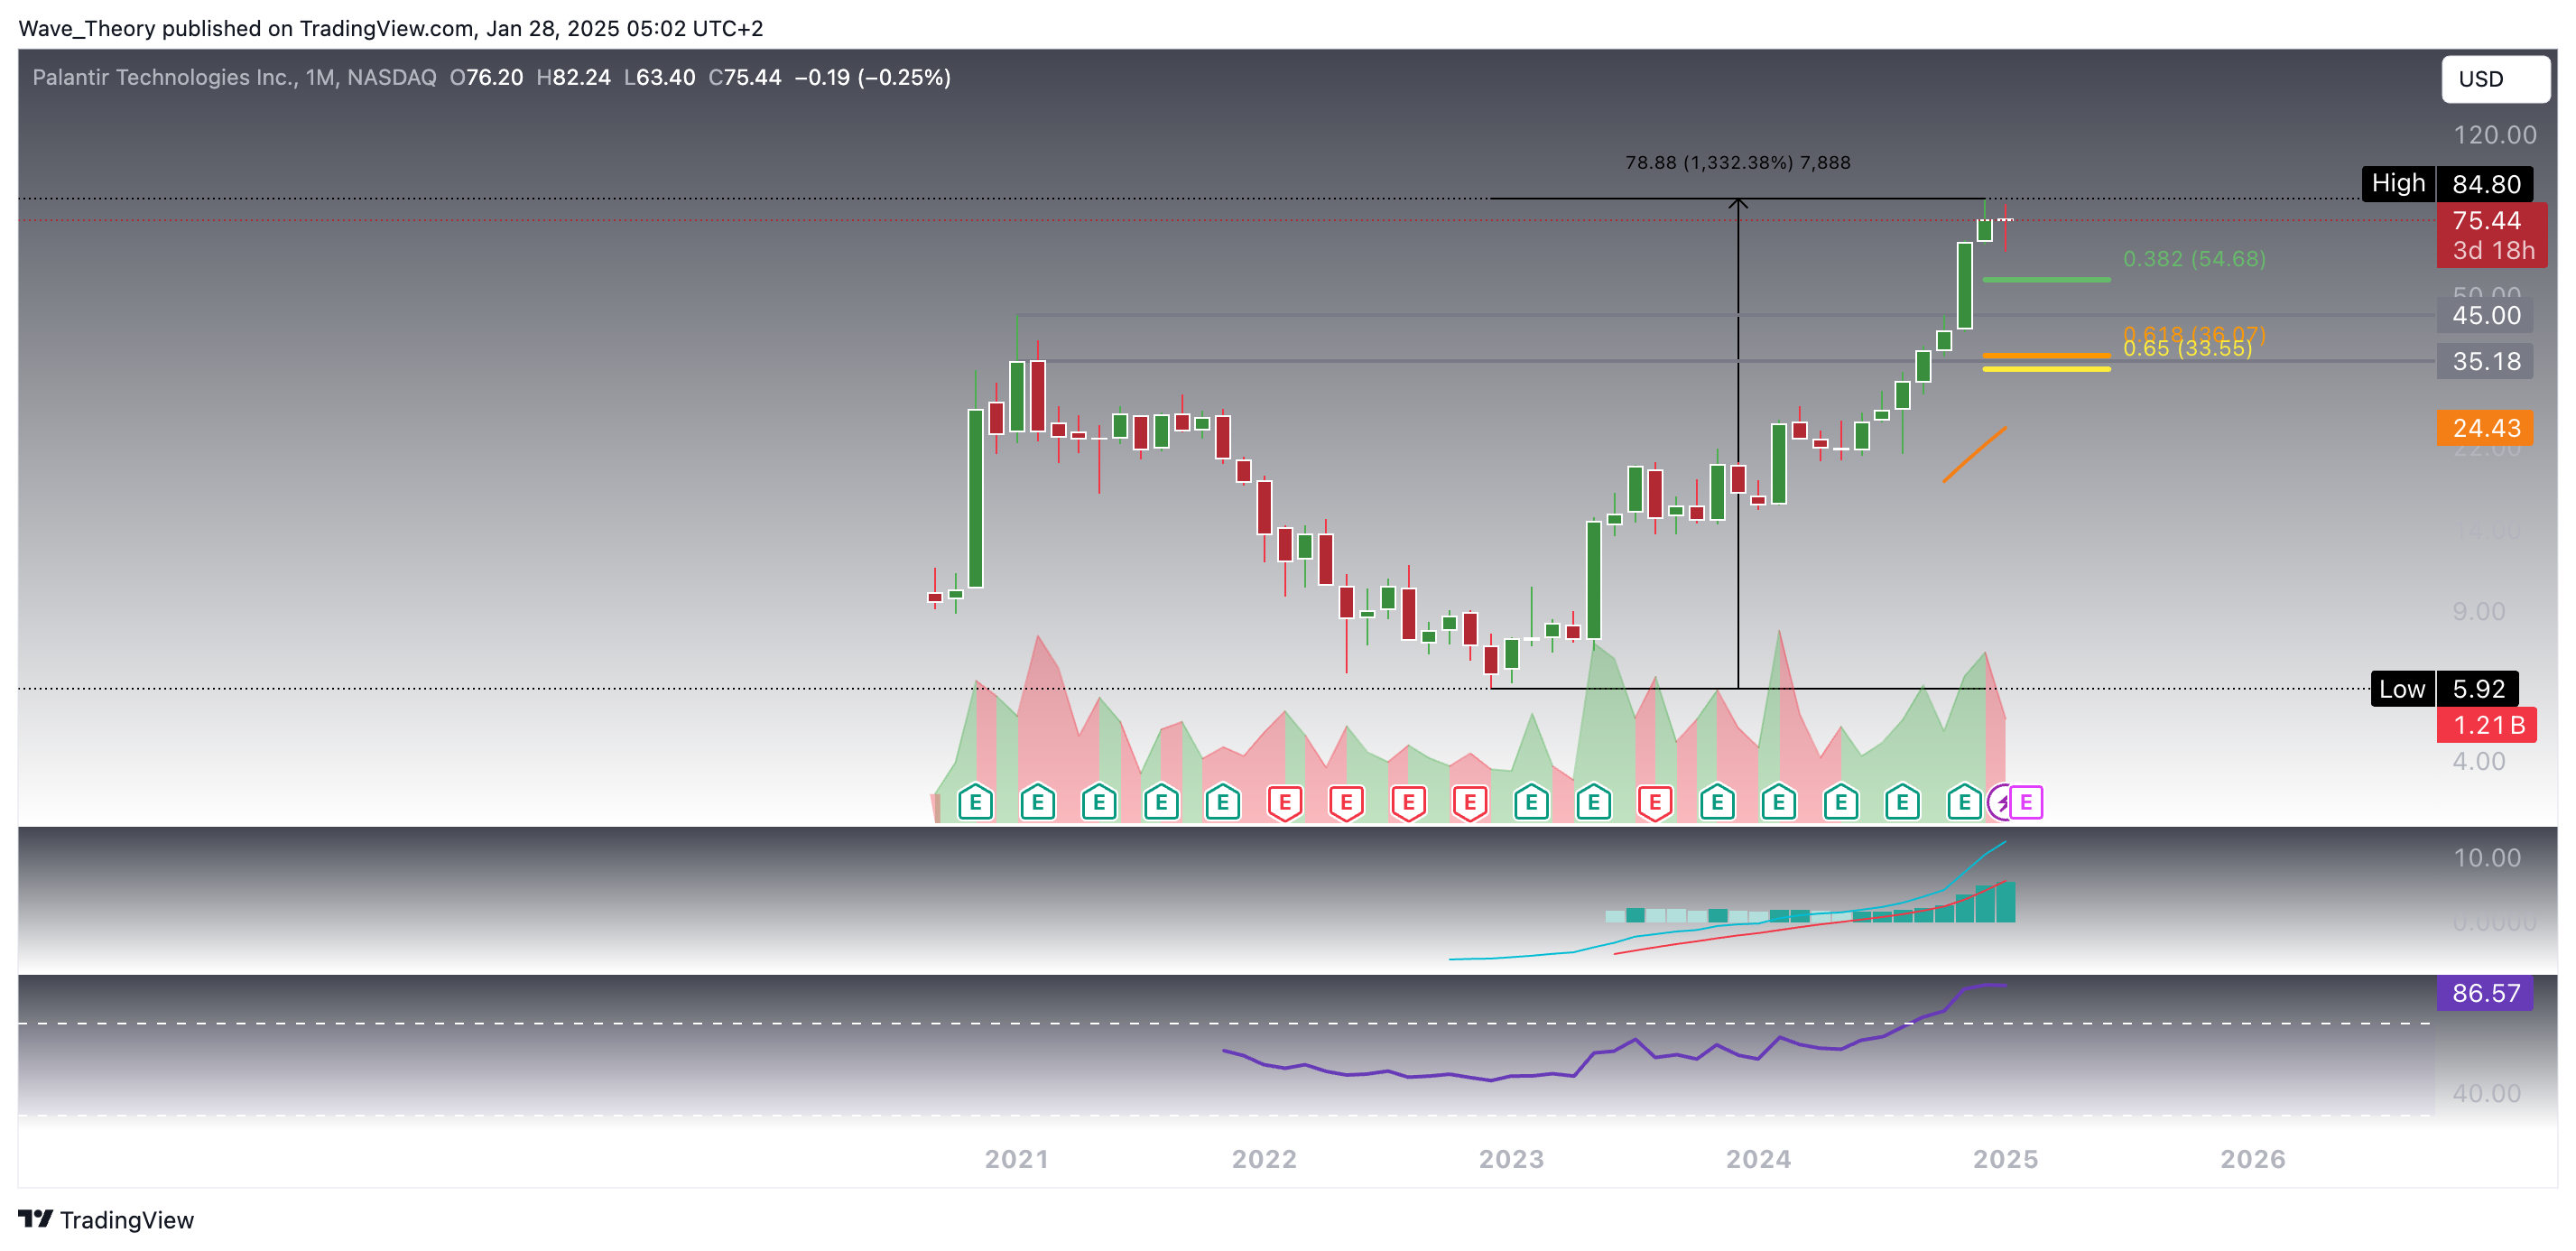
Since hitting its low of $5.92 in December 2022, Palantir (PLTR) stock has surged by an impressive 1,332%, driven by strong bullish momentum. The monthly chart shows a solid uptrend, supported by the MACD histogram which continues to tick higher. Additionally, the MACD lines are in a bullish crossover, signaling continued upward momentum. The RSI is hovering in overbought territory, yet notably, it shows no signs of a bearish divergence, which indicates there may still be room for further gains.
Despite a recent correction this month, the bulls have demonstrated resilience, defending key support levels and successfully pushing the price back up. This suggests the upward trend remains intact, with strong buyer interest at current levels, keeping the bullish outlook alive for Palantir in the near term.
Palantir
Weekly Chart Shows Weakening Bullish Momentum
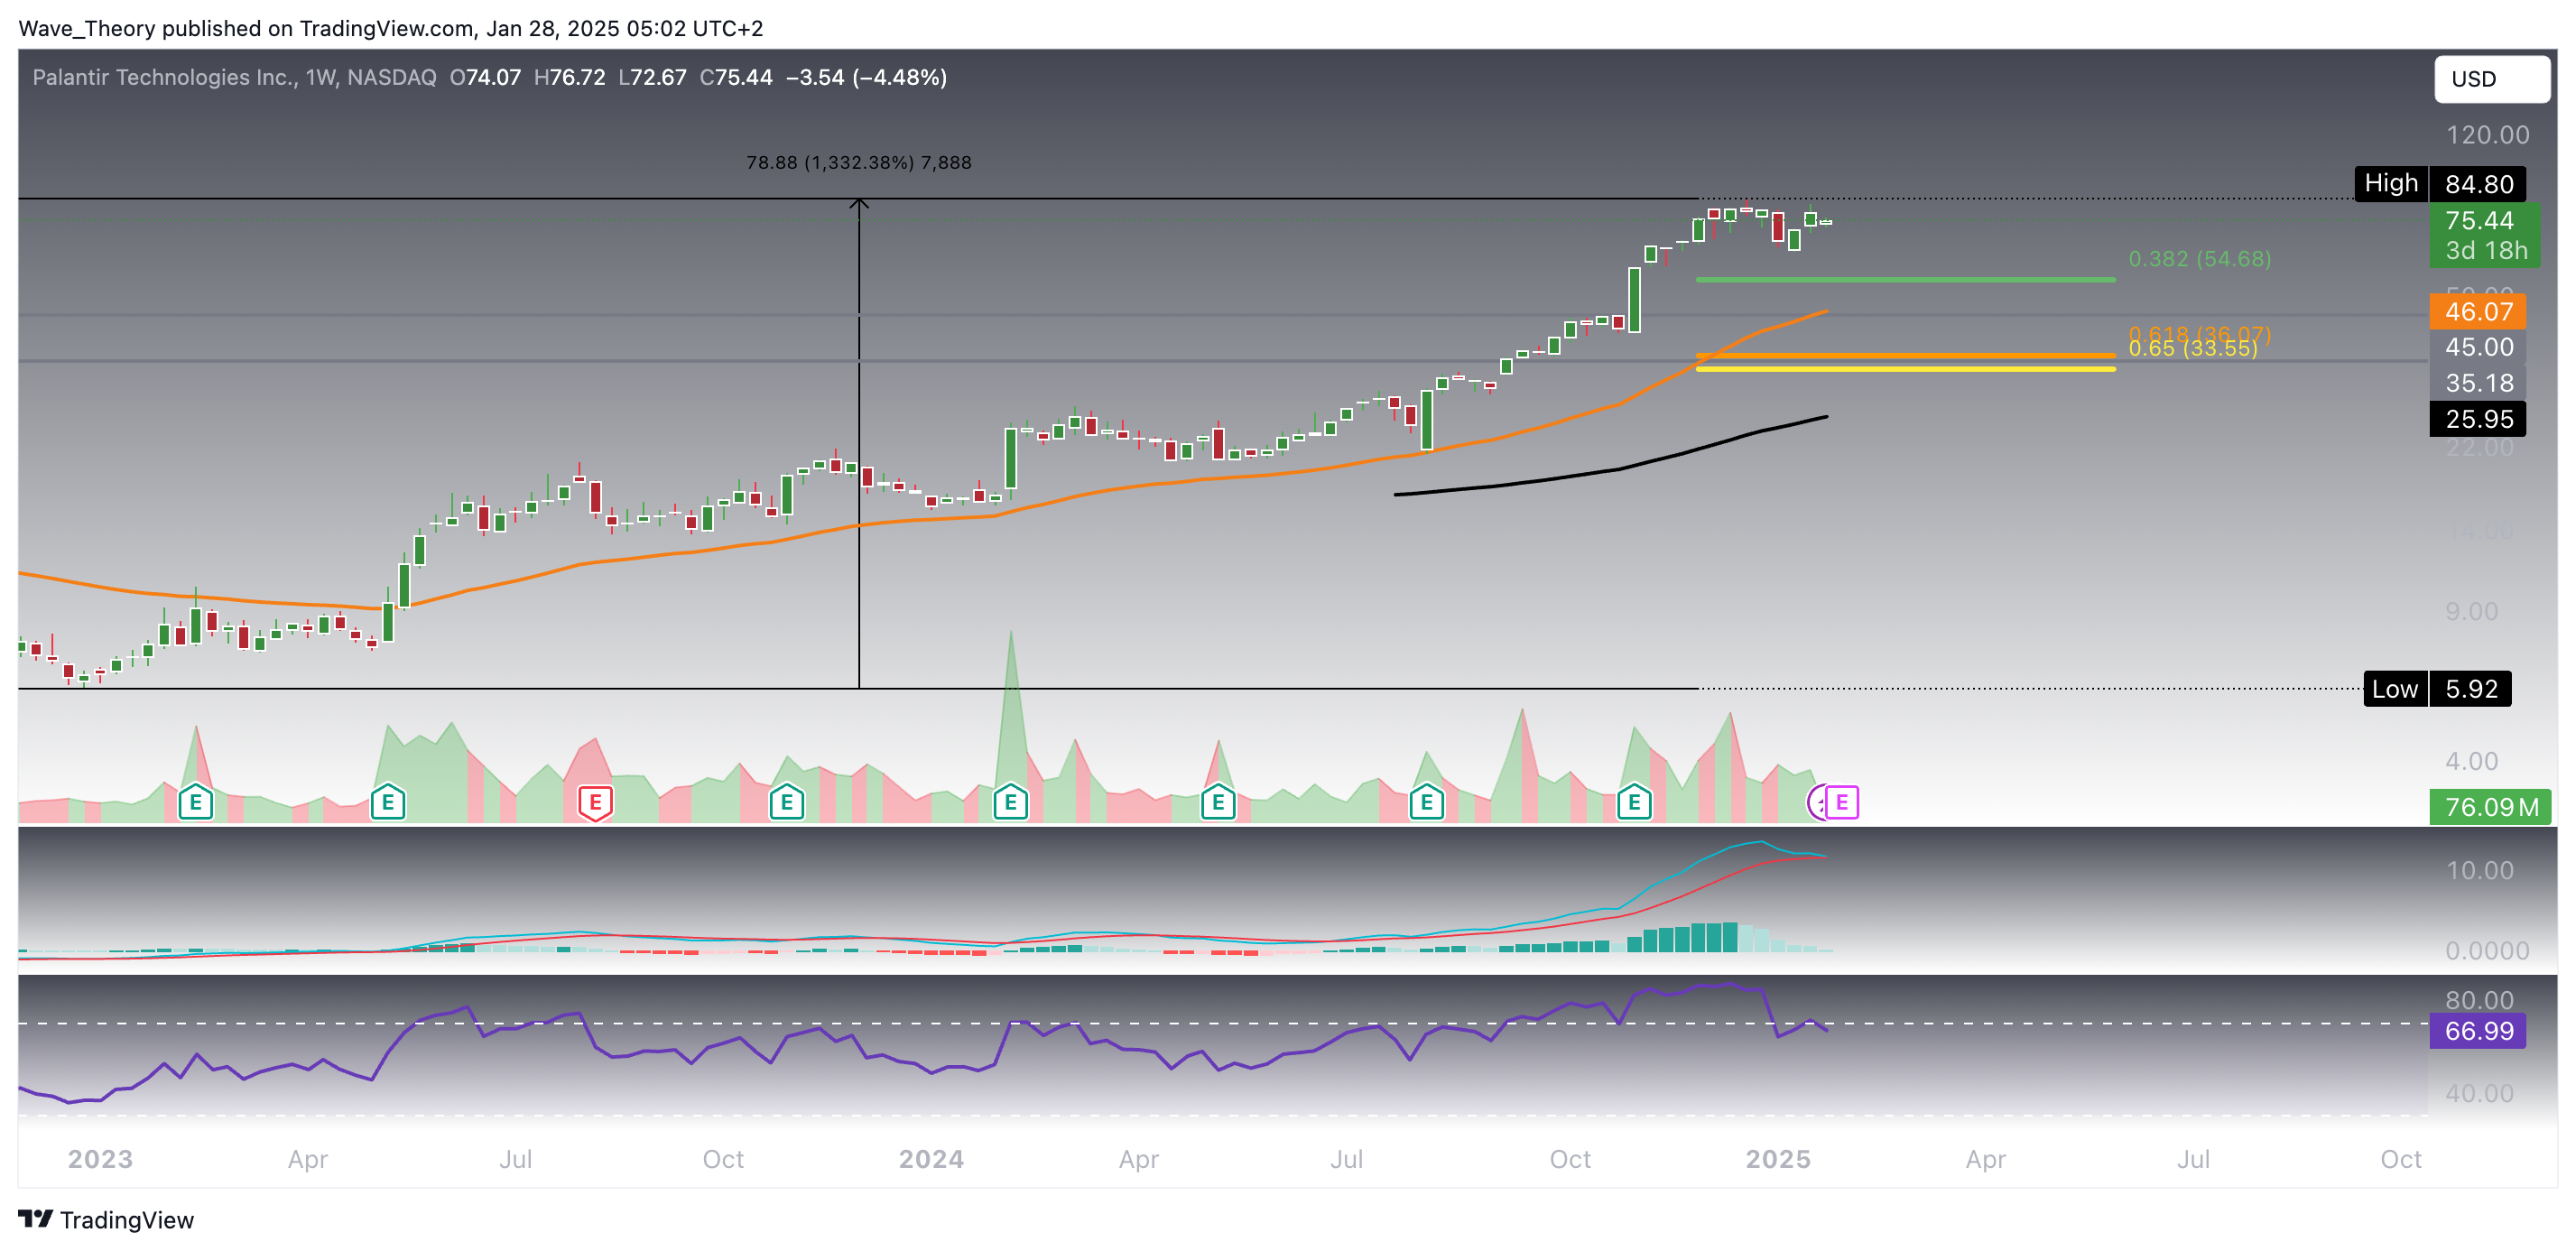
On the weekly chart, there are emerging signs of caution. The MACD lines are on the verge of a potential bearish crossover, as the histogram has been ticking lower for the past six weeks, indicating weakening momentum. Additionally, the RSI is retreating to more neutral levels, suggesting that the overbought conditions are subsiding.
However, the EMAs still affirm the bullish trend in the mid-term, thanks to the presence of a golden crossover, which typically signals continued strength. While there are mixed signals, the ongoing support from the EMAs indicates that buyers could still be in control unless further bearish developments occur.
Palantir
Palantir Stock: Key Support Levels To Watch
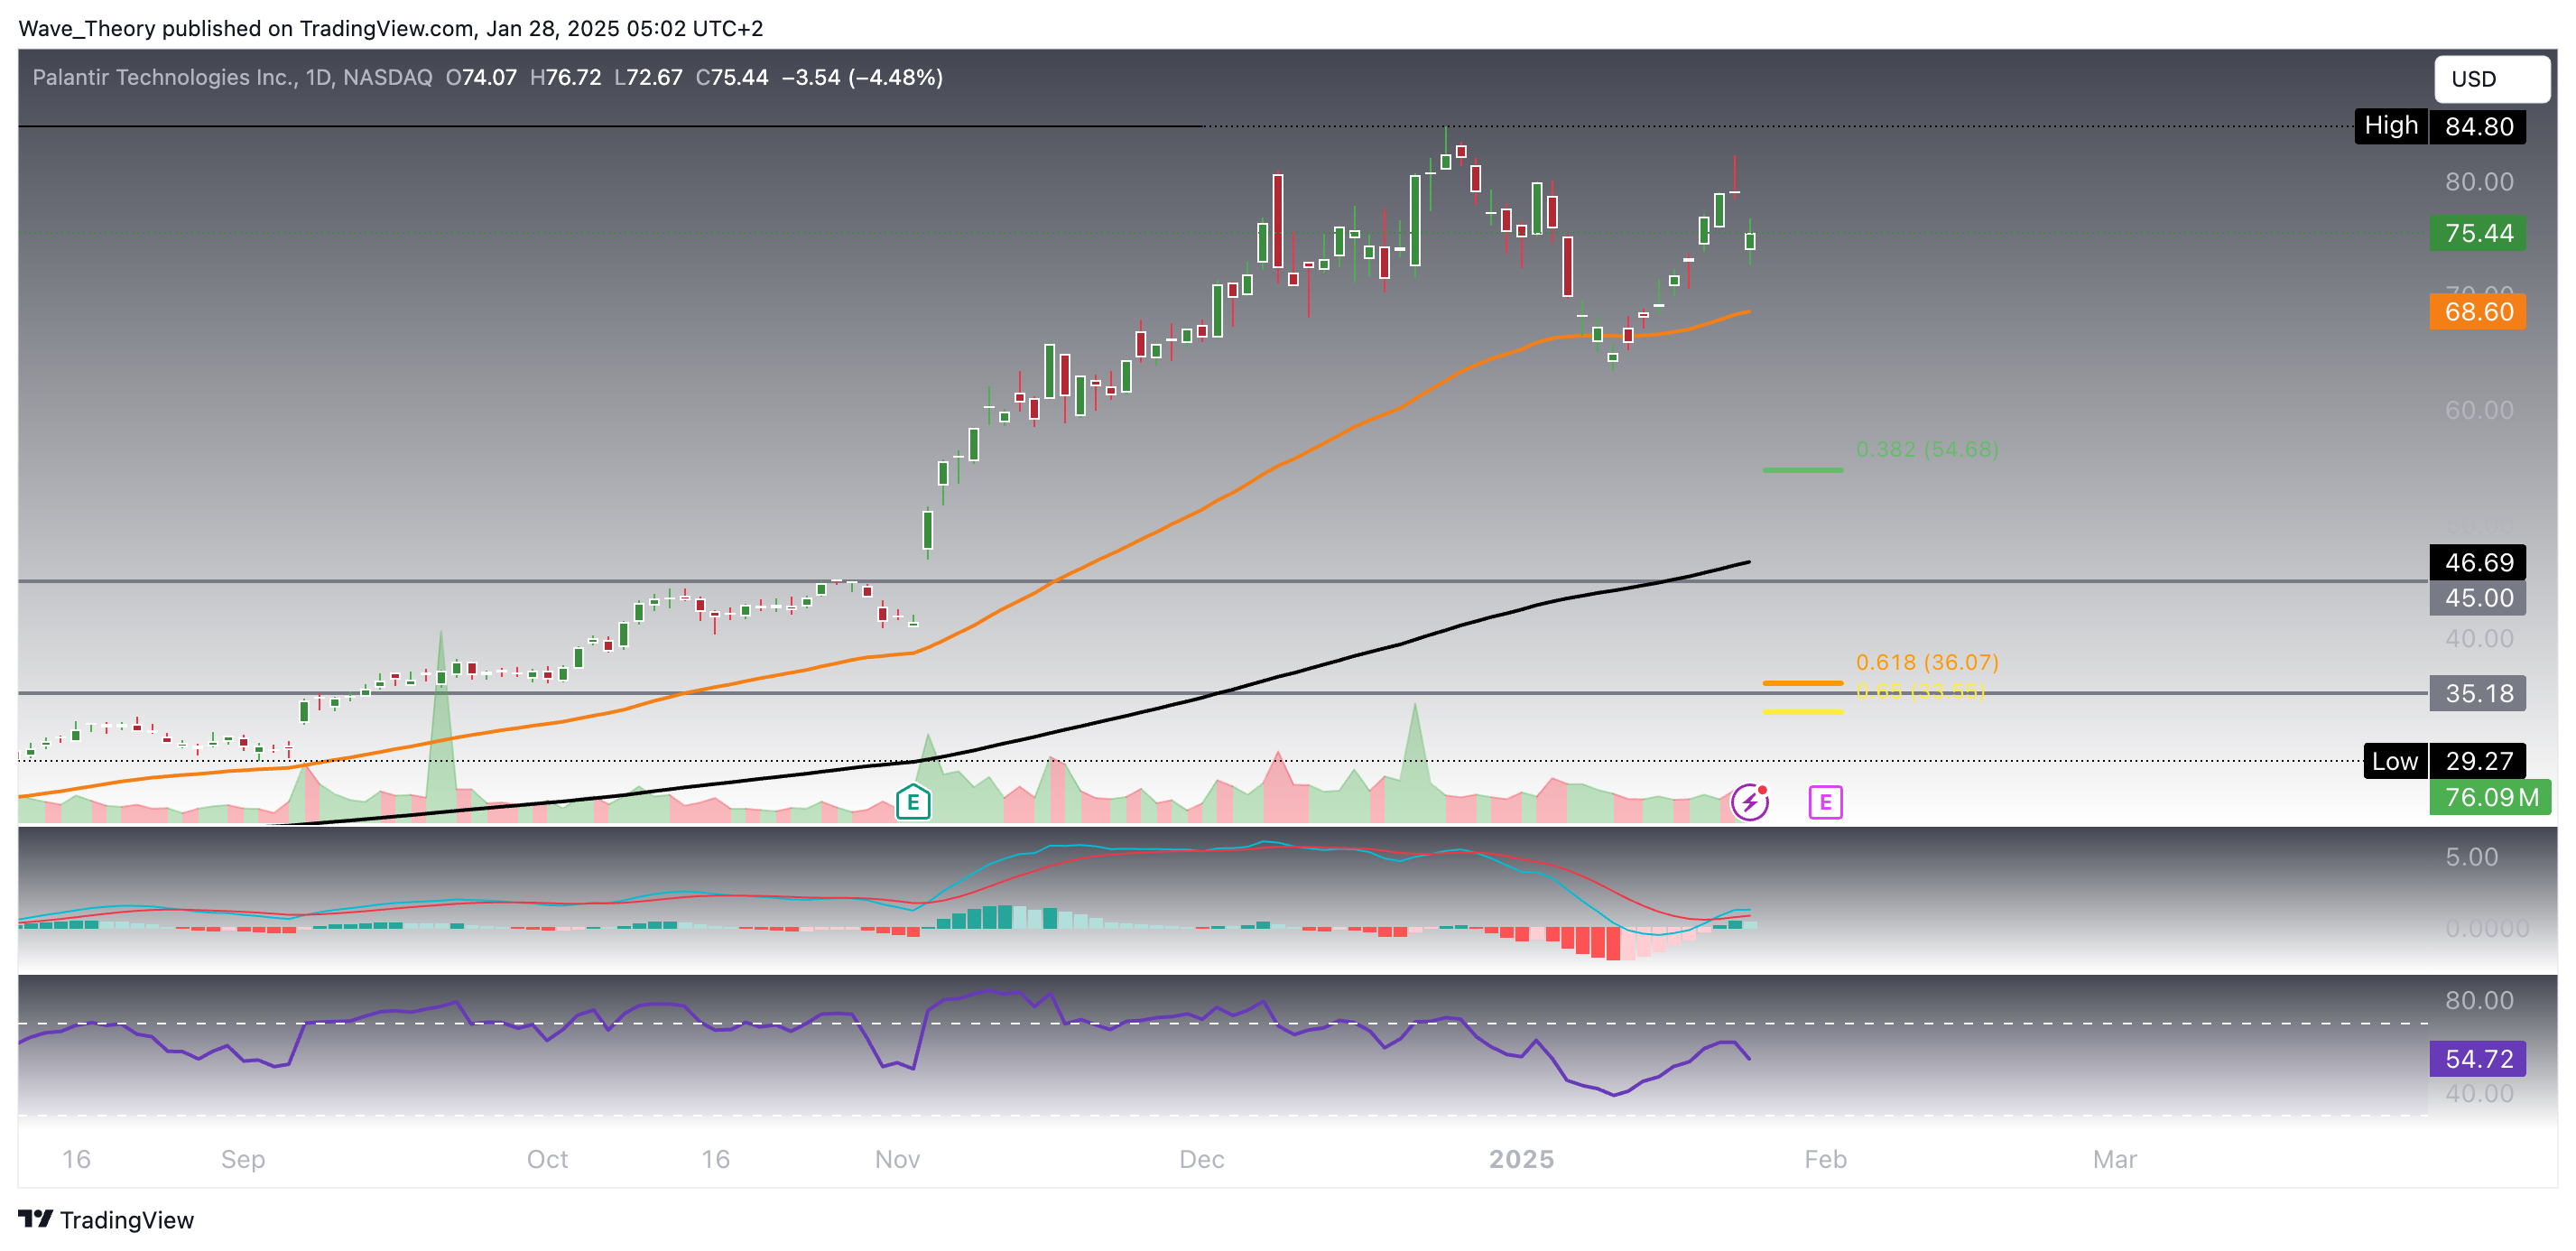
On the daily chart, Palantir shows strong resilience by bouncing off the 50-day EMA support at $68.6, reinforcing its upward momentum. If a steep correction occurs, significant Fibonacci support levels are positioned at $54.7 and $36, with additional support from the 200-day EMA at $46.7.
The indicators remain predominantly bullish. The golden crossover of the EMAs confirms the bullish trend in the short to medium term, while the RSI holds neutral. Furthermore, the MACD lines are bullishly crossed. Though the MACD histogram has started to tick bearishly lower, this could be temporary, as today’s price action suggests continued upward movement.
Palantir
Palantir Bounces Bullishly Off 50-4H EMA, Signaling Continued Uptrend
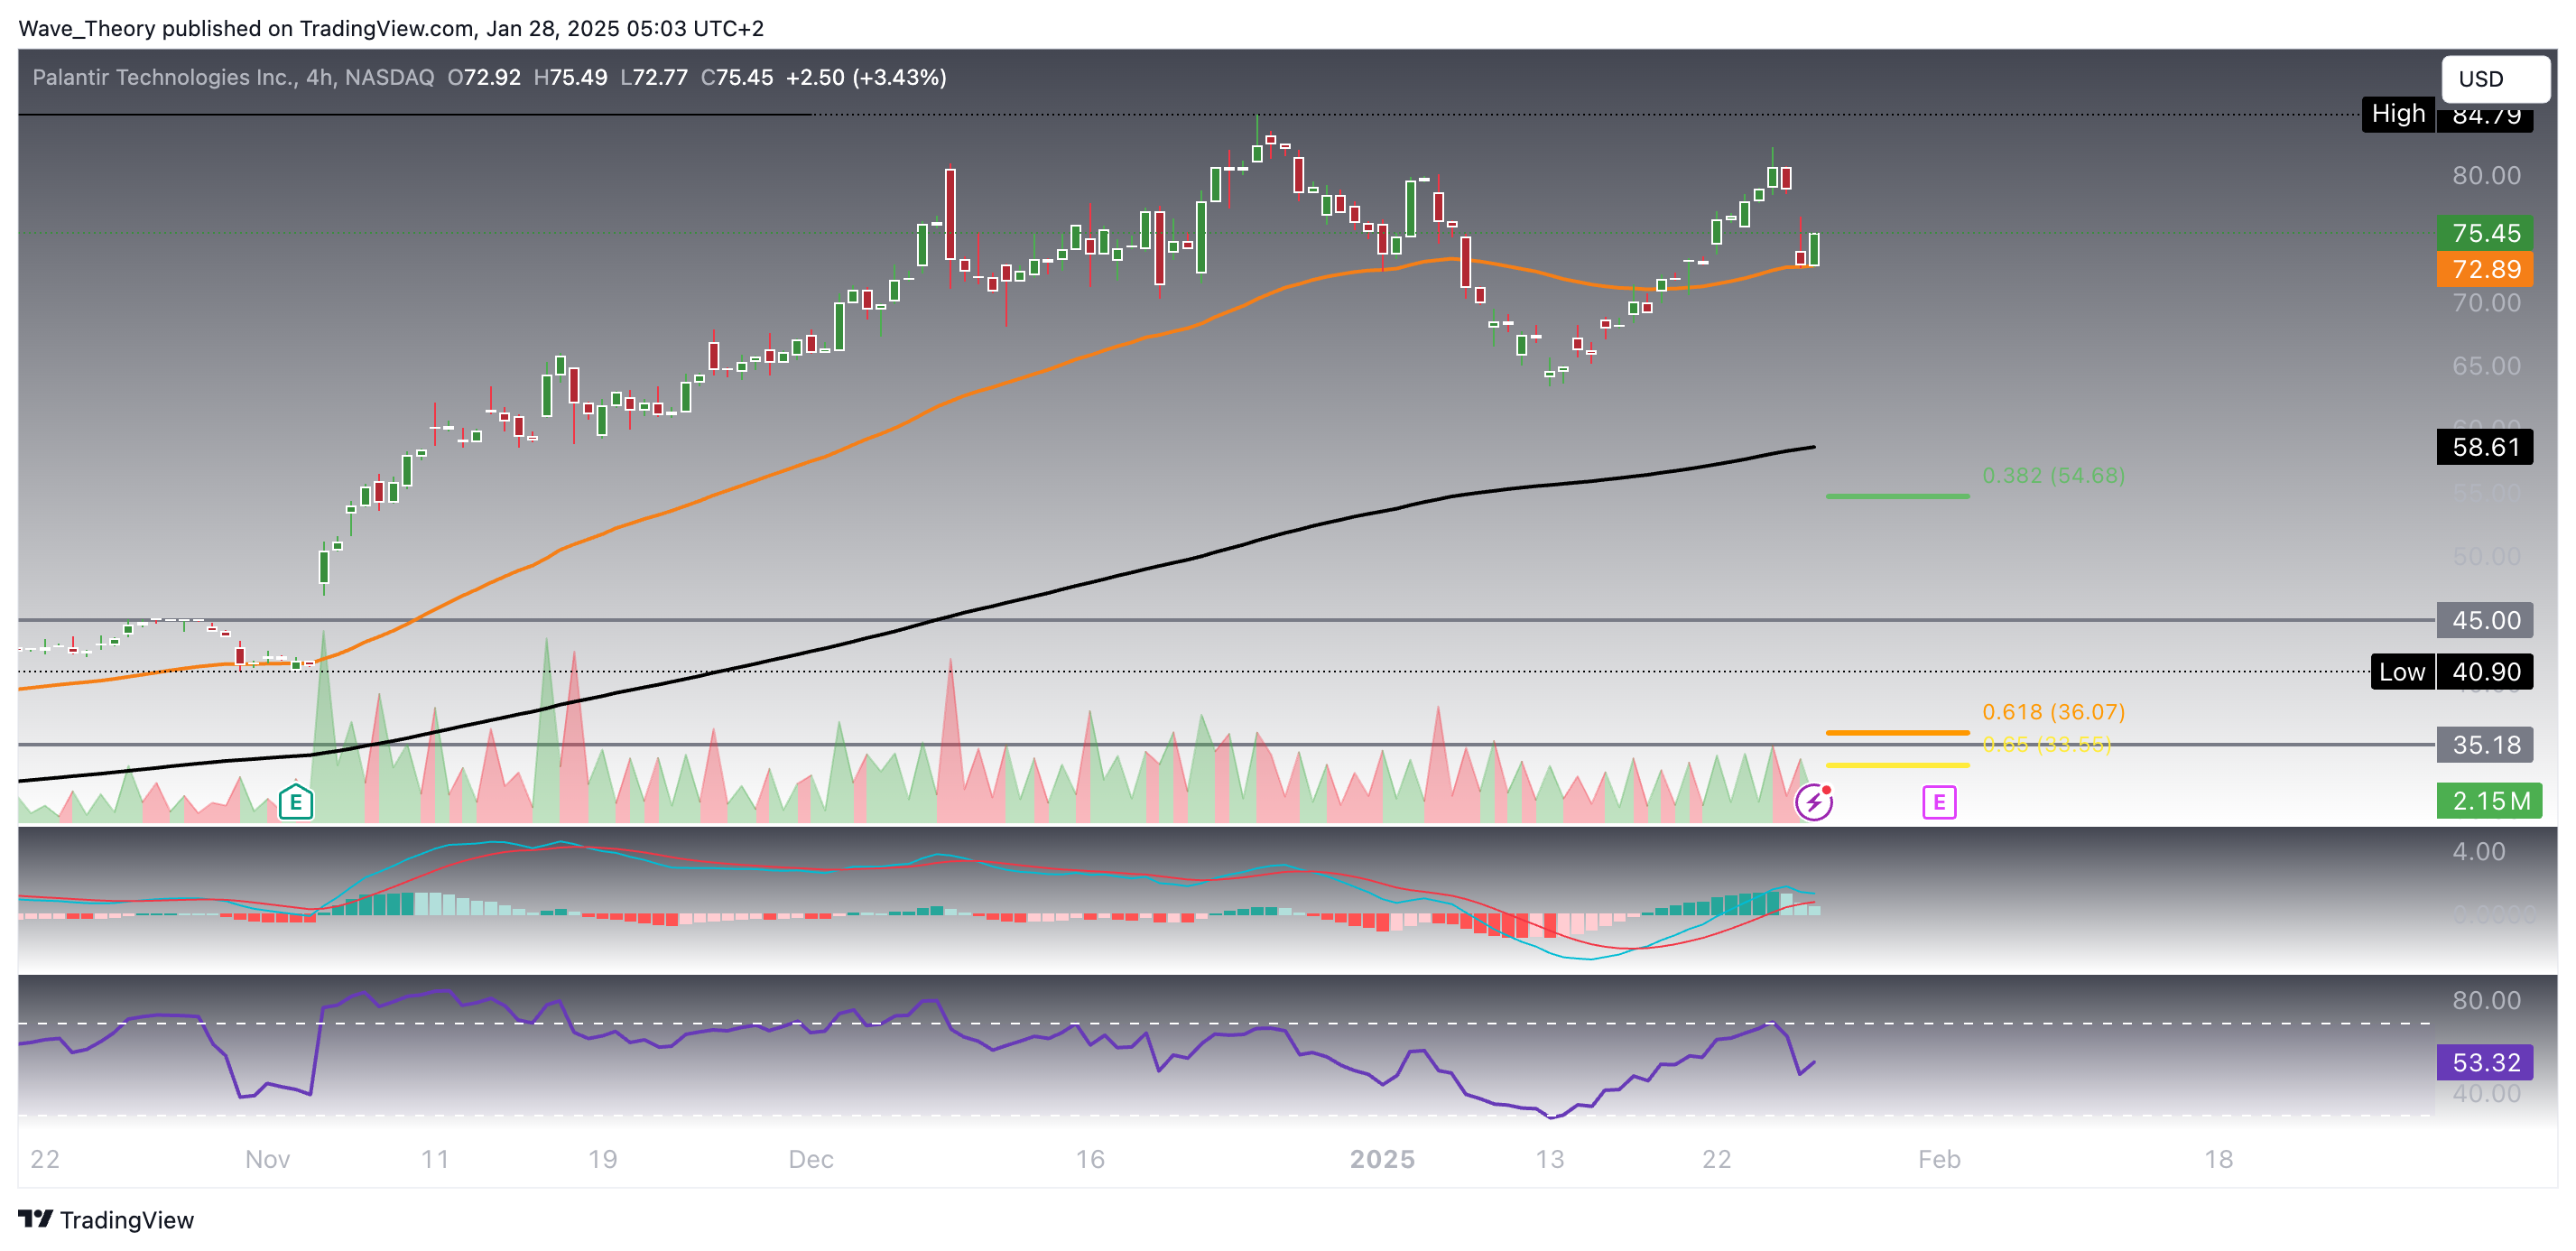
On the 4-hour chart, the technical indicators are largely bullish in the short-term. The RSI is neutral, suggesting there’s no immediate overbought or oversold condition. The MACD lines and EMAs are both bullishly crossed, confirming the current upward trend. However, the MACD histogram has been ticking lower recently, signaling a potential slowdown in momentum.
Despite this, Palantir appears to be bouncing bullishly off the 50-4H EMA today, indicating strong support at this level. If the stock continues its upward trajectory, it faces significant resistance between $82.2 and $84.8, which will be crucial levels to watch for any signs of a potential reversal or continuation.
Konstantin Kaiser comes from a data science background and has significant experience in quantitative trading. His interest in technology took a notable turn in 2013 when he discovered Bitcoin and was instantly intrigued by the potential of this disruptive technology.