Stellar (XLM) Technical Analysis Points to Further Gains After Market Cap Crosses $13.5 Billion
Stellar (XLM) has emerged as a standout performer in the cryptocurrency market, recording a remarkable 5% gain in the past 24 hours and
Stellar (XLM) has emerged as a standout performer in the cryptocurrency market, recording a remarkable 5% gain in the past 24 hours and reclaiming its $13.5 billion market capitalization.
The digital asset has demonstrated exceptional momentum, outpacing its rival XRP and catching the attention of institutional investors.
Stellar (XLM) Market Performance and Recent Developments
With XLM/USD displaying especially strength by detaching from its normal association with XRP, the price increase of the token fits a larger crypto market recovery. XRP saw an 11% increase; Stellar’s explosive climb of over 100% in a 24-hour period sets it as the best performer among the top 100 cryptocurrencies.
Former Ripple co-founder Jed McCaleb of Stellar recently underlined the basic distinctions between XLM and XRP, stressing unique consensus procedures and technical aspects separating the two platforms. Investors seem to be connecting with this difference, which could help XLM to have autonomous price action.
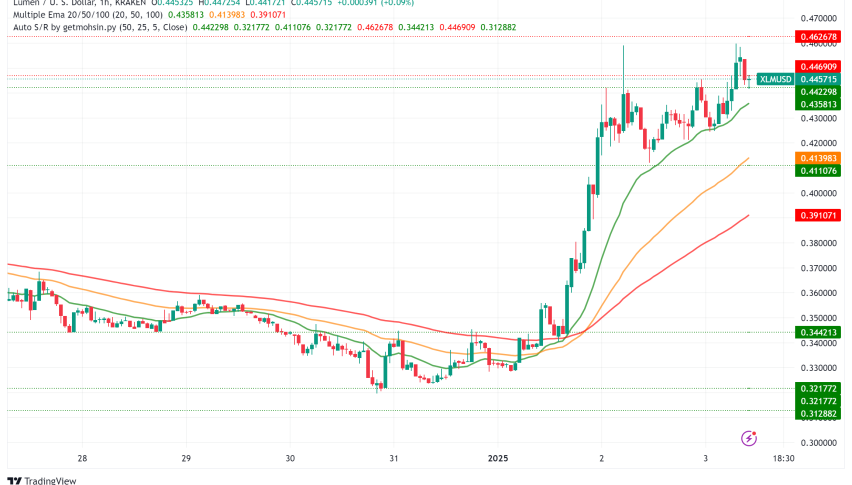
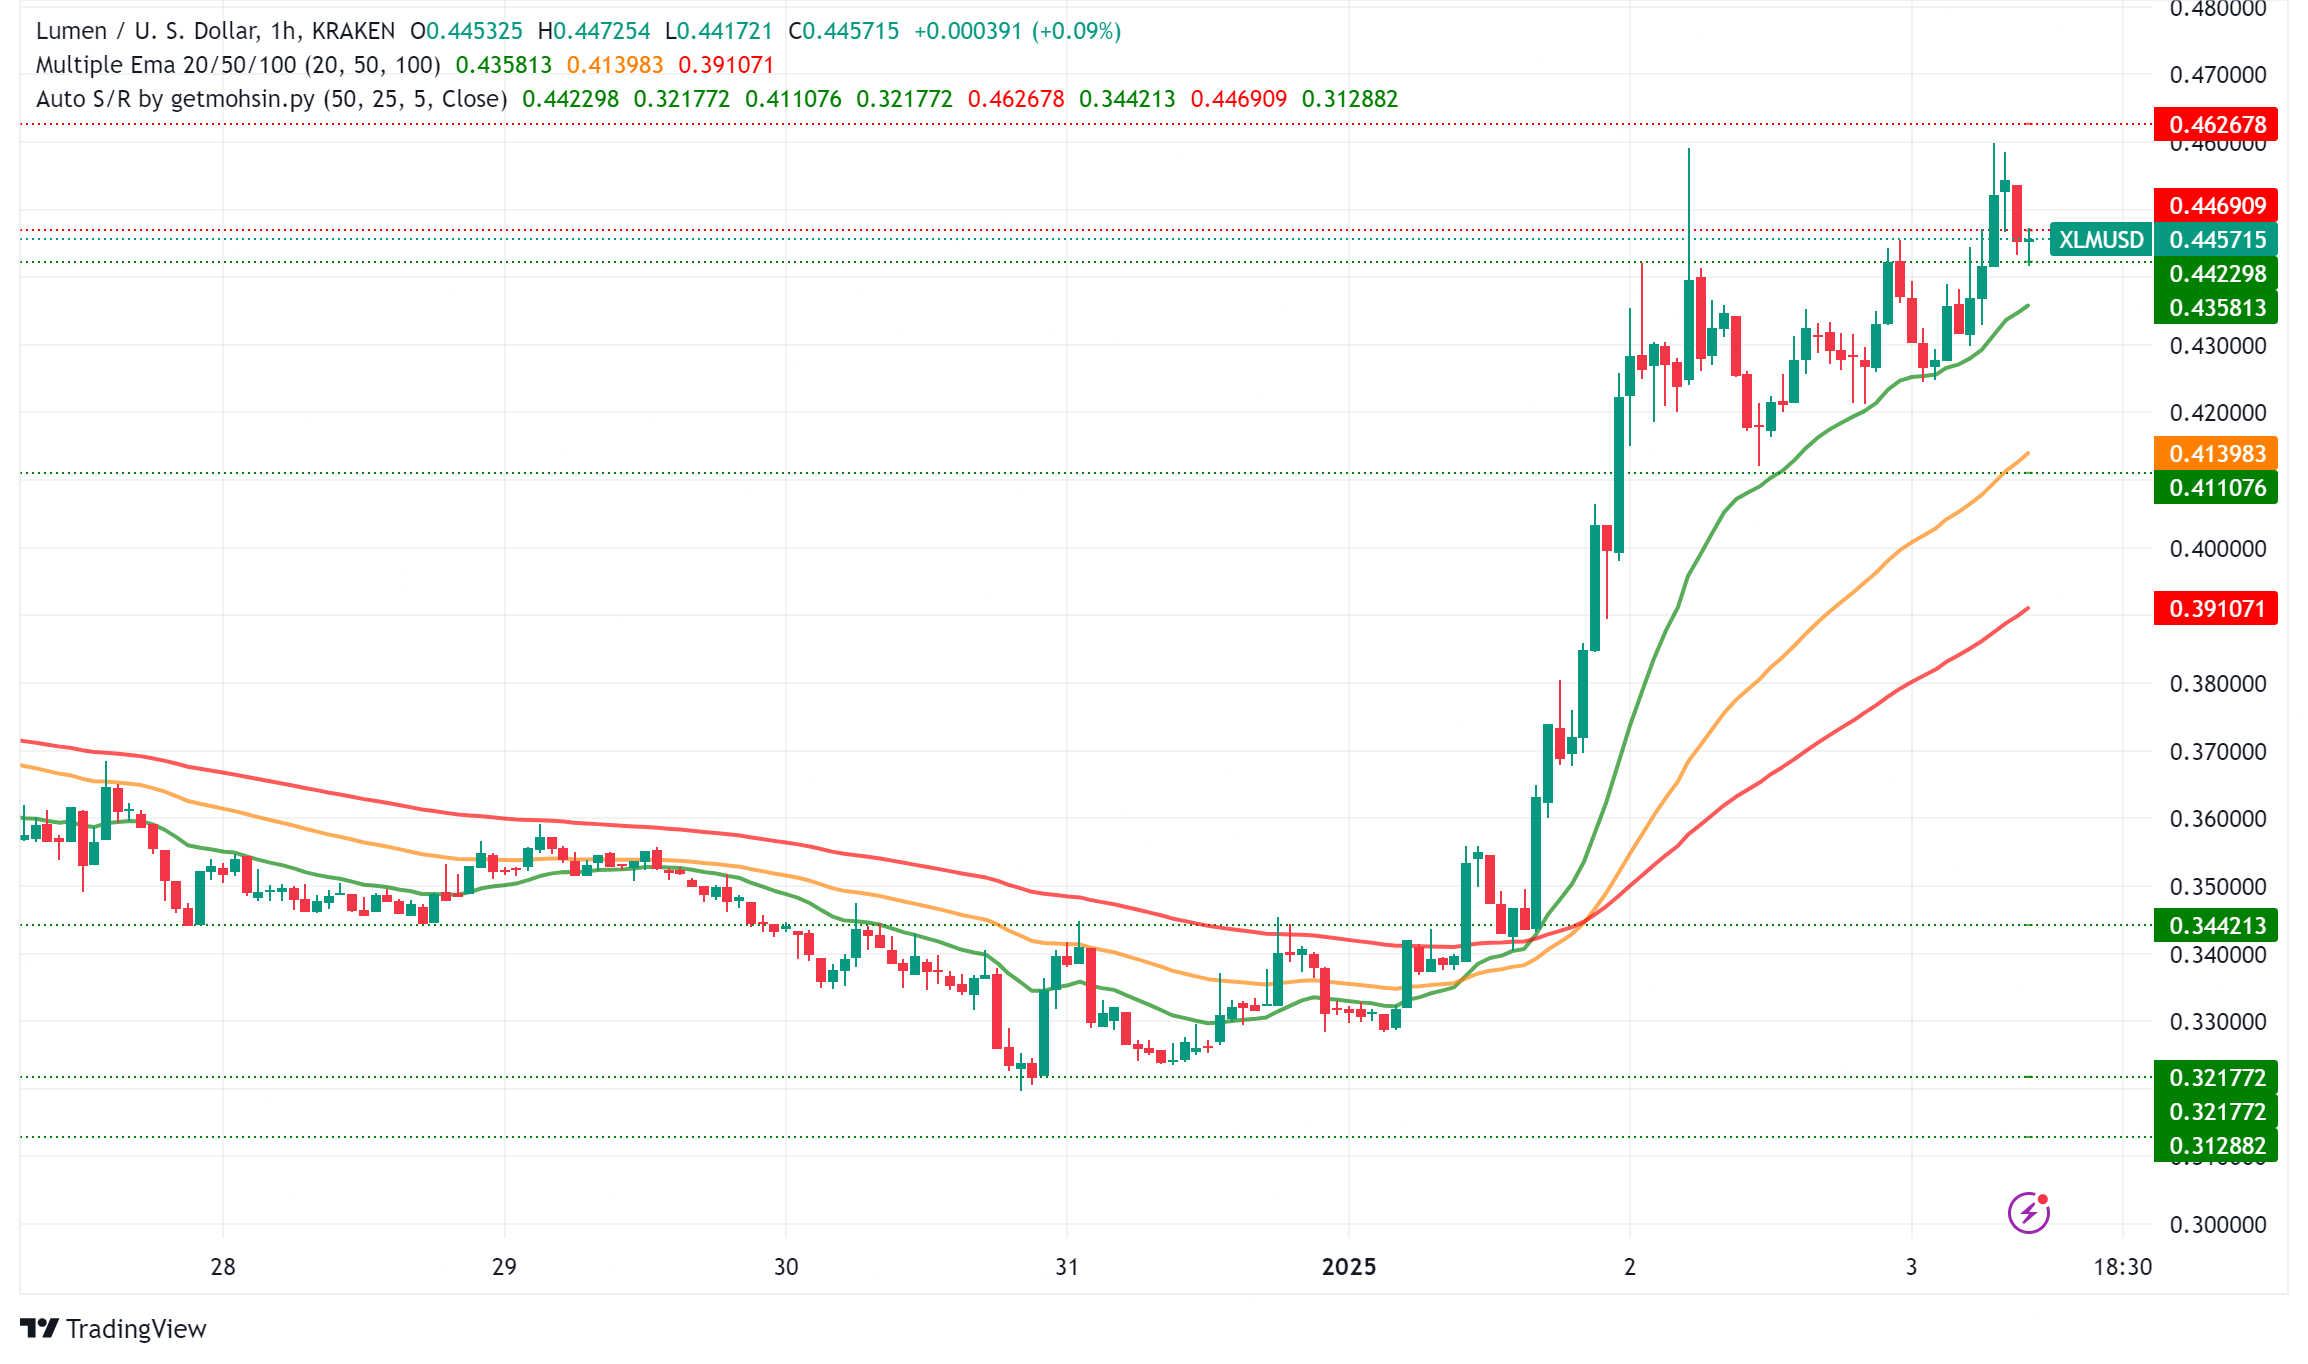
XLM/USD Technical Analysis
Momentum Indicators
Currently standing at 71.1, the Relative Strength Index (RSI) stays in overbounded area since January 1. This points to great purchasing demand but also signals a moment of temporary consolidation. With the ADX rising to 19.5 and the +DI hitting 25.6, notably surpassing the -DI at 13.9, the Directional Movement Index (DMI) suggests increased optimistic momentum.
Chart Patterns and Key Support Levels
A notable falling wedge pattern has formed on the 8-hour chart, typically a bullish continuation signal. The price is currently testing the upper boundary of this pattern, with a breakout potentially triggering an accelerated upward movement.
Key price levels to watch:
- Immediate Resistance: $0.47
- Critical Support: $0.41
- Secondary Support: $0.31
Analyzing Volume and Capital Flow
At 0.02 the Chaikin Money Flow (CMF) indicator has turned positive, significantly reversing its previous negative level of -0.20. This change points to rising capital inflow and stronger purchasing power, therefore supporting the present trend.
Key Considerations for Investors
The current technical setup presents a compelling risk-reward ratio, but investors should consider several factors:
- The overbought RSI suggests potential short-term volatility
- Volume confirmation will be crucial for validating the breakout
- The decoupling from XRP could indicate a fundamental shift in market perception
Stellar (XLM) Price Prediction
Technical setup suggests XLM is positioned for continuous upward movement; numerous scenarios are possible:
Bullish Scenario
A successful break above the $0.47 resistance level could open the path to the psychological $0.50 mark. The falling wedge pattern suggests a potential upside target of $0.65, representing a 40% gain from current levels.
Bearish Scenario
Failure to maintain support at $0.41 could trigger a correction toward $0.31, representing a 27% decline. A daily close below $0.24 would invalidate the bullish setup and potentially lead to further downside.
- Check out our free forex signals
- Follow the top economic events on FX Leaders economic calendar
- Trade better, discover more Forex Trading Strategies
- Open a FREE Trading Account
Related Articles
Comments
Sidebar rates
Related Posts
