


Gold Price Nears $2,650 Ahead of Fed Meeting: What to Expect?
Gold prices held steady on Tuesday at $2,652.92 as investors turned cautious ahead of the Federal Reserve’s policy meeting.

Traders are focused on the U.S. central bank’s rate outlook for 2025, with markets widely anticipating a 25-basis-point cut. However, Fed Chair Jerome Powell’s statements and the updated “dot plot” will set the tone for the first half of next year.
Jigar Trivedi, senior analyst at Reliance Securities, noted, “The yellow metal may witness a technical correction, but that would be an opportunity to go long.”
Key Levels to Watch for Gold Prices
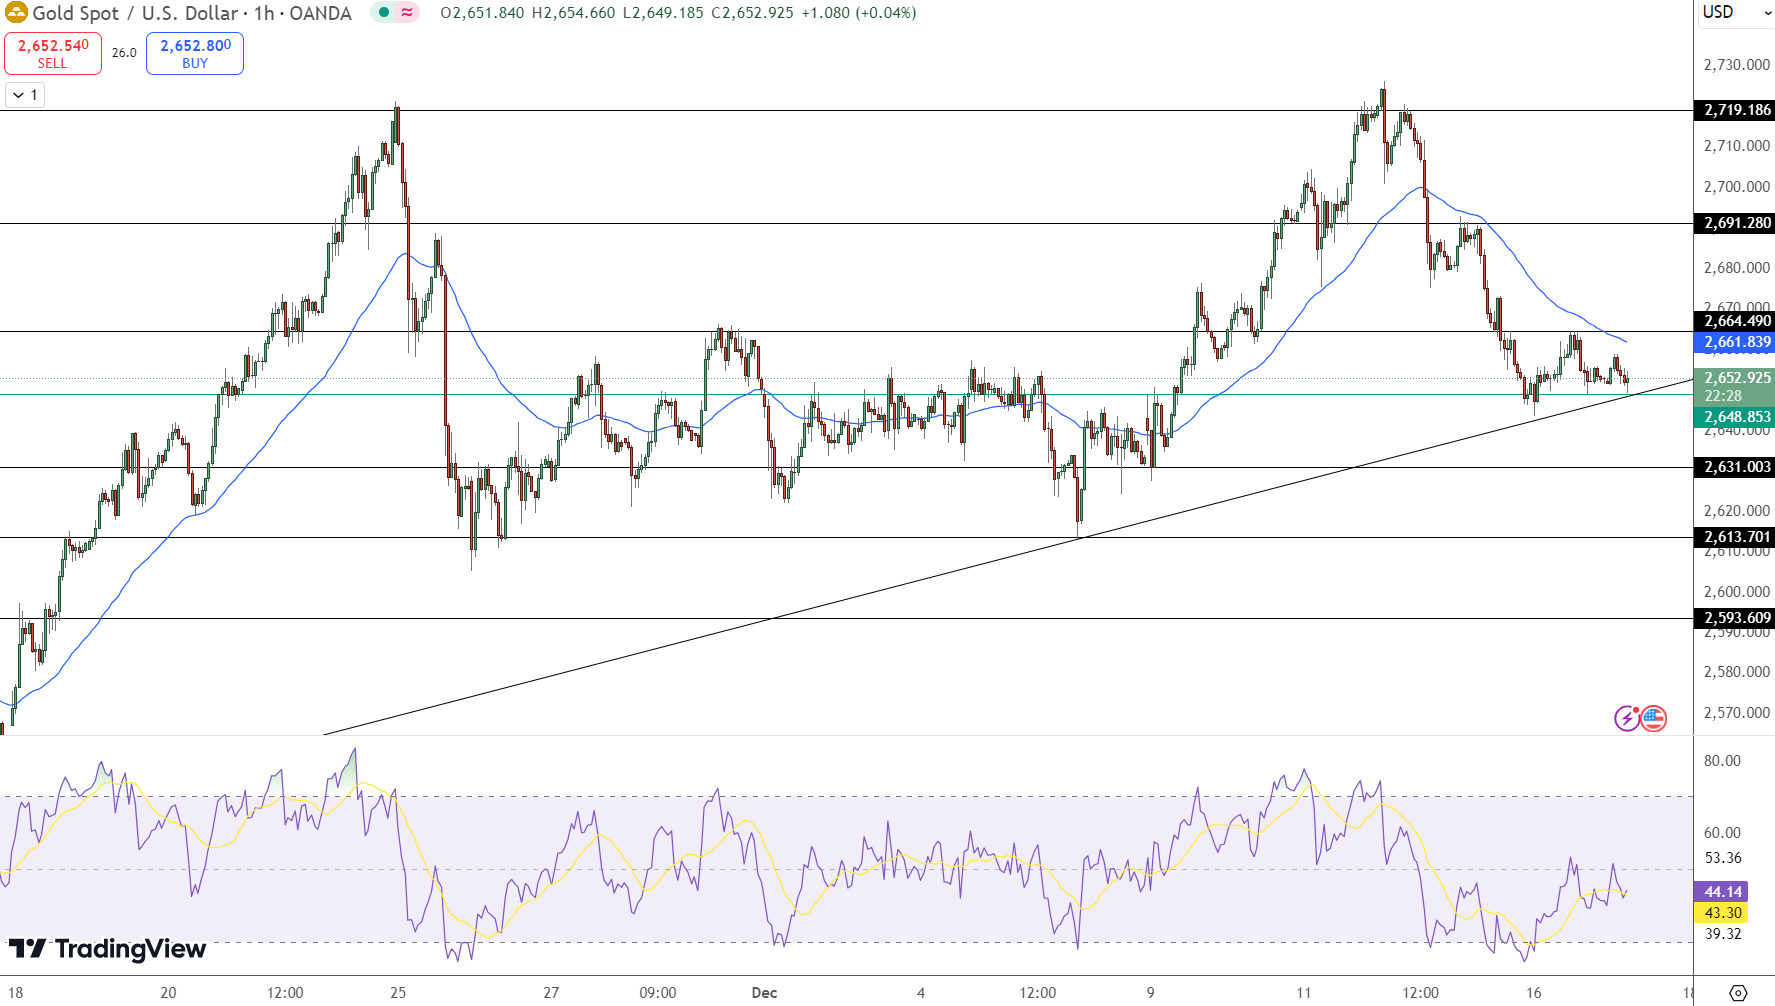
Gold’s technical outlook shows interim support at $2,648.85, aligning with an ascending trendline that has remained intact since late November. This upward slope indicates sustained buying interest at lower levels.
- Immediate Resistance: $2,661.83 (50-EMA)
- Next Resistance: $2,664.49 and $2,691.28
- Immediate Support: $2,648.85
- Next Support: $2,631.00 and $2,613.70
A breach of the $2,661.83 resistance level, where the 50-day Exponential Moving Average (EMA) lies, could push prices higher toward the $2,691 region. Conversely, a failure to hold above the trendline might trigger a decline to $2,631.00, with further downside risk at $2,613.70.
Federal Reserve Meeting and Economic Indicators
Markets currently estimate a 96.3% probability of a quarter-point rate cut, according to the CME FedWatch Tool. Yet, expectations of an additional rate reduction in January remain low at 16.5%. Non-yielding gold typically gains in a lower interest rate environment as it becomes more attractive compared to bonds.
Adding to investor caution, key economic data releases, including the U.S. GDP and inflation figures, are due later this week. These reports will further influence gold’s direction. On the geopolitical front, U.S. sanctions on North Korea and Russia have amplified global tensions, bolstering gold’s safe-haven appeal.
Technical Indicators Reflect Cautious Sentiment
Gold’s Relative Strength Index (RSI) sits at 44.14, reflecting indecisive sentiment but a slight rise in buying momentum. Meanwhile, the 50-EMA at $2,661.83 remains a critical short-term resistance level.
Key Takeaways:
- Immediate Support: $2,648.85 aligns with the upward trendline.
- Resistance Levels: $2,661.83 and $2,691.28 are key upside barriers.
- The Fed meeting and economic data this week will determine gold’s next move.


Sidebar rates
Related Posts
Add 3440

