


BNB Faces Resistance at $761: Will Bulls Reclaim $800?
Binance Coin (BNB) has seen significant price action this week, maintaining its position among the top-performing cryptocurrencies.
While it recently achieved a 10% weekly rise, the token is encountering key resistance levels that could determine its near-term trajectory. In the past 24 hours, BNB has experienced a minor correction, raising questions about whether the bulls will sustain the rally.
Weekly Surge Propels BNB to $746 Amid Market Optimism
BNB has gained momentum, trading at $746.09, up 4.37% in the last 24 hours, with a robust trading volume of $2.73 billion. Last week, BNB saw a 10% price surge, reaching a peak of $721 and pushing its market cap to $107.44 billion.
This rally aligned with broader crypto market trends, fueled by declining Bitcoin dominance and increased DeFi Total Value Locked (TVL), which rose 6%, according to Binance Research.
The market’s “extreme greed” sentiment, reflected by the fear and greed index at 80, also contributed to BNB’s bullish performance.
However, this optimism triggered a price correction, with BNB falling by over 2% in the last 24 hours, potentially signaling a temporary bearish phase. Social metrics, including a decline in BNB’s dominance and negative weighted sentiment, indicate waning enthusiasm among traders.
Technical Indicators Point to Key Resistance Levels
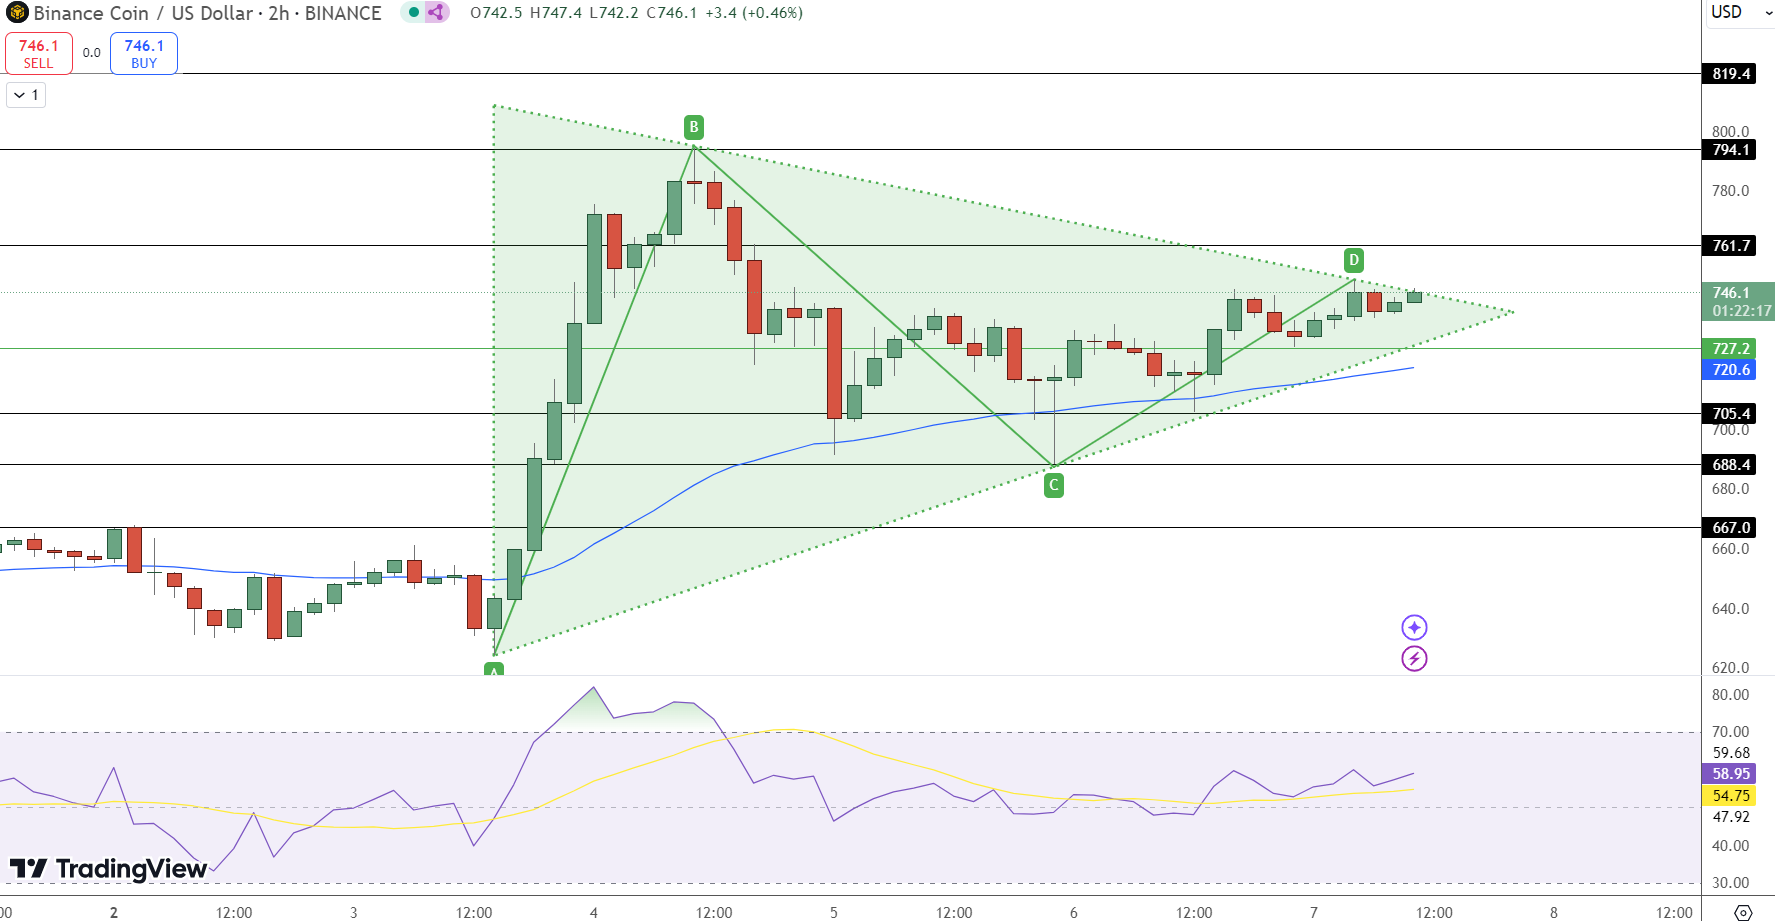
BNB currently faces immediate resistance at $761.70, a critical level that could determine whether the bullish momentum persists. A successful breakout above this point would target higher resistance levels at $794.10 and $819.40, potentially paving the way for a climb toward $800.
Conversely, immediate support is observed at $727.20, with additional cushions at $705.40 and $688.40.
Technical indicators support the potential for further gains. The Relative Strength Index (RSI) is at 58.95, signaling moderate bullish momentum without nearing overbought conditions.
Additionally, BNB’s price remains above the 50-day Exponential Moving Average (EMA) at $720.60, reinforcing its upward trend.
A symmetrical triangle pattern visible on the chart suggests a potential breakout, but traders should monitor the pivot point at $746 closely for signs of a trend reversal.
Bullish Reversal or Extended Correction?
While technical indicators favor a bullish outlook, mixed data highlight caution. A 33% dip in trading volume over the last 24 hours suggests reduced buying interest, which could limit upside potential.
The Chaikin Money Flow (CMF) remains neutral, indicating minimal new inflows, while the RSI’s slight southward movement raises the possibility of a near-term pullback.
If the bulls manage to reclaim momentum, BNB could retest the $744-$761 range before targeting $800. However, if the price falls below $727.20, a deeper correction to $710 or lower may be on the horizon.
Key Takeaways:
Resistance Levels: Critical resistance stands at $761.70, with further targets at $794.10 and $819.40.
Support Levels: Immediate support at $727.20, followed by $705.40 and $688.40.
Momentum Indicators: RSI at 58.95 and price above 50-day EMA signal sustained bullish sentiment.
BNB traders should watch $761 for a breakout or $727 for potential downside risk as the market navigates this consolidation phase.


Sidebar rates
Related Posts
Add 3440

