Bitcoin Price Smashes $100,000: Targets $103,800 Amid Breakout Rally
Bitcoin has shattered the $100,000 mark, a historic milestone that has electrified the cryptocurrency market. This landmark price surge is fueled by a bullish breakout from a symmetrical triangle pattern, signaling further upside potential.
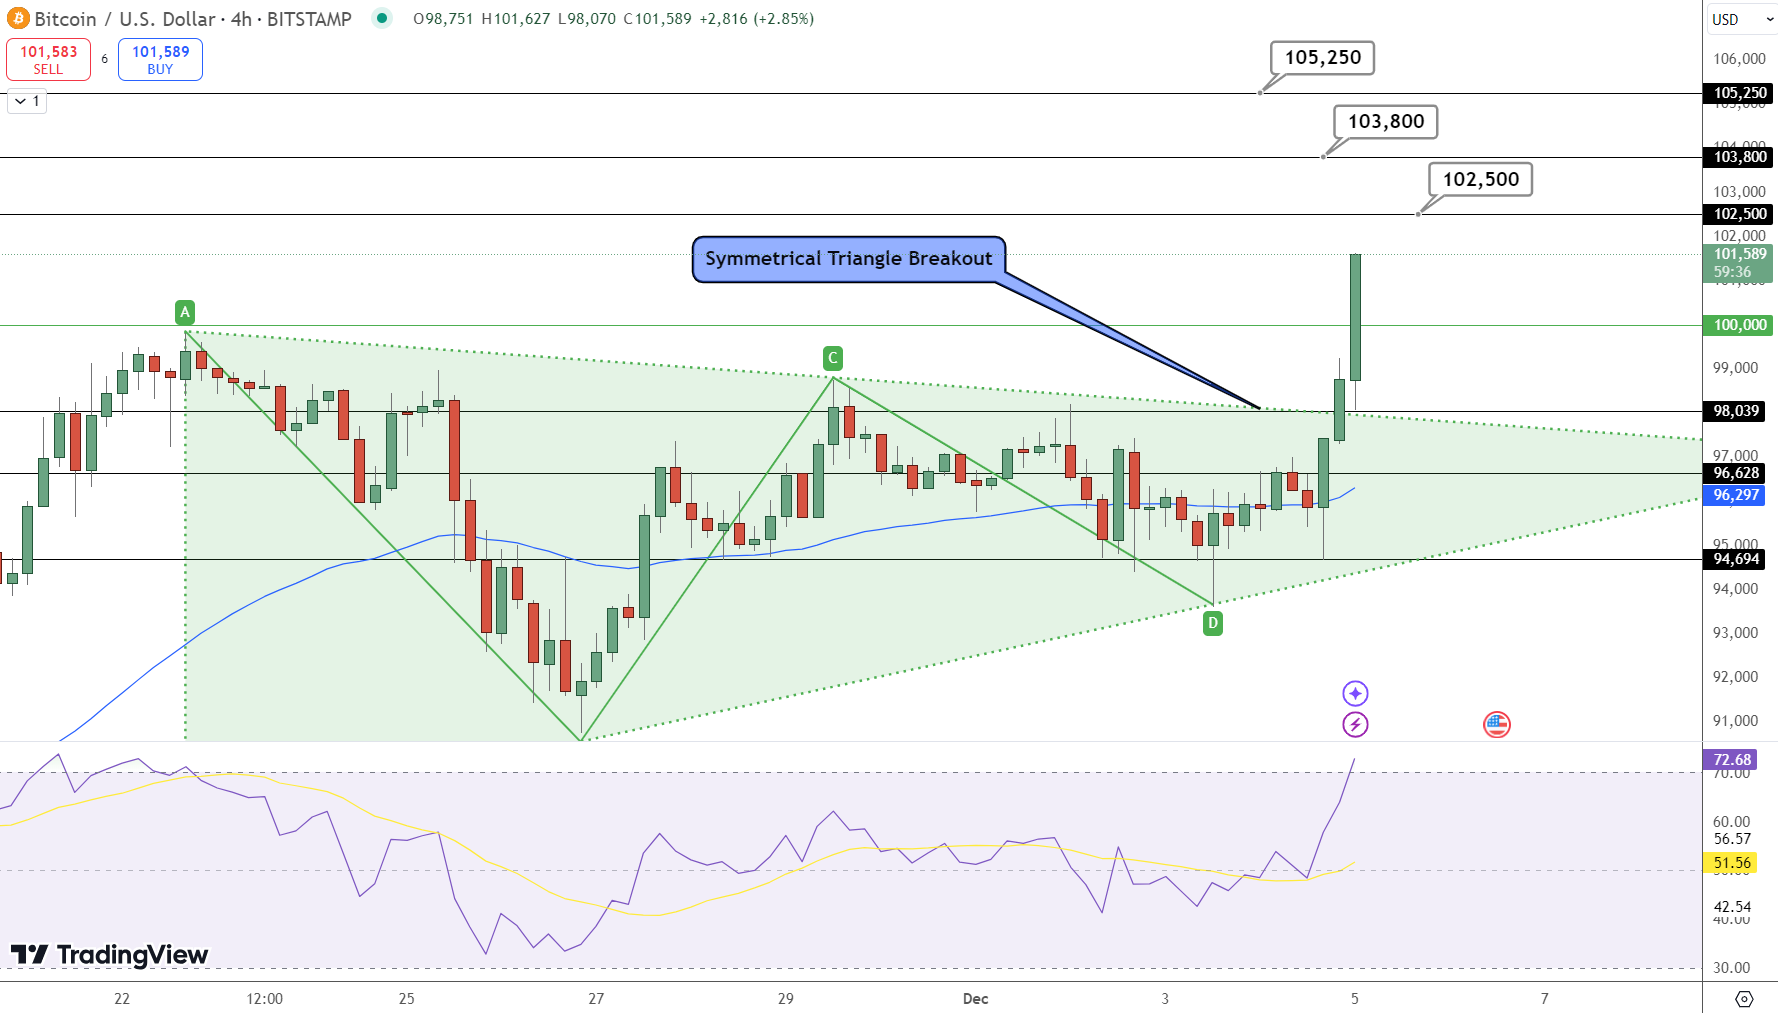
Currently trading at $101,650, Bitcoin’s momentum suggests a strong possibility of testing the next major resistance levels at $102,500 and $103,800 in the near term.
| Broker | Review | Regulators | Min Deposit | Website | |
|---|---|---|---|---|---|
| 🥇 |  | Read Review | FCA, CySEC, ASIC, MAS, FSA, EFSA, DFSA, CFTC | USD 100 | Visit Broker |
| 🥈 | Read Review | FSCA, FSC, ASIC, CySEC, DFSA | USD 5 | Visit Broker | |
| 🥉 |  | Read Review | CySEC, MISA, FSCA | USD 25 | Visit Broker |
| 4 |  | Read Review | ASIC, BaFin, CMA, CySEC, DFSA, FCA, SCB | USD 200 | Visit Broker |
| 5 |  | Read Review | ASIC, FCA, CySEC, SCB | USD 100 | Visit Broker |
| 6 | Read Review | FCA, FSCA, FSC, CMA | USD 200 | Visit Broker | |
| 7 | Read Review | BVI FSC | USD 1 | Visit Broker | |
| 8 |  | Read Review | CBCS, CySEC, FCA, FSA, FSC, FSCA, CMA | USD 10 | Visit Broker |
| 9 |  | Read Review | ASIC, CySEC, FSCA, CMA | USD 100 | Visit Broker |
| 10 |  | Read Review | IFSC, FSCA, ASIC, CySEC | USD 1 | Visit Broker |
The breakout has been accompanied by significant trading activity, with daily volumes exceeding $89.67 billion, underscoring heightened investor interest. Market sentiment remains overwhelmingly bullish, as Bitcoin leads the charge in the broader crypto market rally.
Key Levels and Indicators Driving Momentum
Resistance Levels to Watch:
- Immediate Resistance: $102,500
- Next Resistance: $103,800
- Major Resistance: $105,250
Support Levels in Case of Pullback:
- Immediate Support: $98,039
- Dynamic Support (50 EMA): $96,628
- Major Support: $94,694
Technical indicators point to overbought conditions, with the RSI at 72.83. While this reflects strong buying pressure, it also suggests the potential for a short-term correction before resuming the rally. The 50 EMA at $96,628 serves as a key support zone that could cushion any pullbacks, keeping the bullish structure intact.
🚨 Breaking News: Bitcoin smashes past $100,000! 🚀📈
Bullish breakout signals targets of $102,500 & $103,800 next. RSI hints at strong momentum but watch for short-term corrections. Is $105,250 in sight? 🔥 #Bitcoin #CryptoNews #BTC pic.twitter.com/1Z251E012G— Arslan Ali (@forex_arslan) December 5, 2024
What’s Next for Bitcoin?
The surge above $100,000 has captivated traders worldwide, with many now targeting $103,800 as the next major milestone. The clean breakout from a symmetrical triangle pattern—combined with the formation of “three white soldiers” on the 4-hour chart—indicates that Bitcoin’s bullish momentum remains robust.
Key takeaways for traders:
- Breakout Confirmed: Bitcoin’s move above $100,000 validates the bullish trend, with $103,800 in sight.
- Support Zones Hold the Key: Retracements could stabilize around $98,039 or the 50 EMA at $96,628.
- Caution Advised: Overbought RSI suggests the possibility of short-term consolidation before further gains.
With Bitcoin’s live market cap nearing $2 trillion and a circulating supply of 19.79 million BTC, the cryptocurrency’s climb to six figures has set the stage for an exciting new phase in its price trajectory.


Add 3442

Related Posts
Add 3440