


The Sandbox (SAND) Surges 70% in 7 Days: Key Levels to Watch
The Sandbox (SAND) has been making waves in the crypto market, with its price soaring by more than 70% over the last seven days.
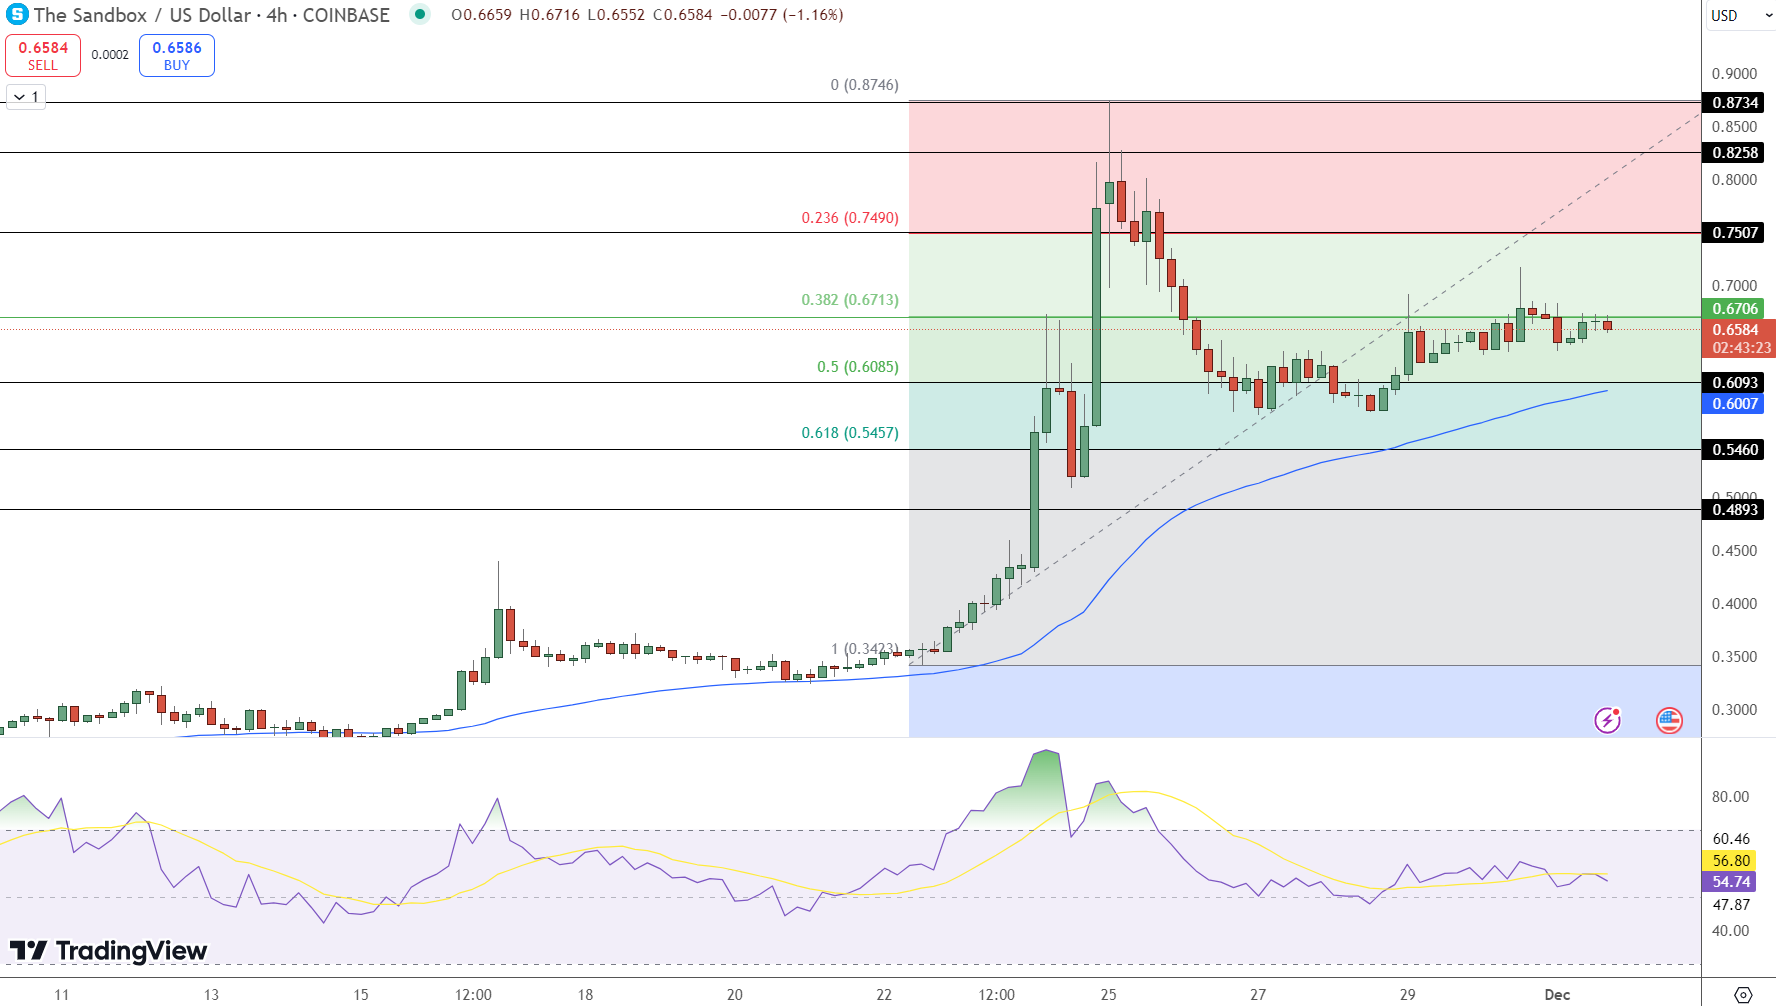
SAND’s price is currently hovering near the 38.2% Fibonacci retracement level at $0.6713, a critical zone for maintaining bullish momentum.
The rally reflects strong investor interest, driven by the platform’s growing popularity as a play-to-earn metaverse ecosystem. Its unique virtual land offerings and increasing user base continue to attract attention, bolstering price performance despite minor corrections.
Immediate resistance lies at $0.7490, followed by $0.8258, while support can be found at $0.6085 and $0.5457. Traders remain optimistic about SAND’s potential to retest its recent highs, provided market sentiment stays positive.
Broader Market Trends Support SAND
The broader cryptocurrency market is also contributing to SAND’s bullish outlook. The global crypto market cap has risen by 1% to $3.38 trillion, with total trading volume climbing 11% to $170 billion. The Fear and Greed Index currently reads 82/100, indicating extreme optimism among investors.
Bitcoin (BTC) remains range-bound between $95K and $98K, while altcoins like XRP and ENS have outperformed with notable price surges of 17% and 27%, respectively. These trends highlight strong momentum in the altcoin market, providing a favorable backdrop for The Sandbox’s continued growth.
Moreover, SAND’s performance reflects its ability to capitalize on the positive market sentiment. As investor interest in metaverse projects grows, SAND is likely to remain a key beneficiary, riding the wave of optimism that is driving significant capital inflows across the crypto space.
Technical Outlook: Key Levels to Monitor
The technical indicators for SAND suggest a neutral-to-bullish outlook:
- Resistance Levels: Immediate at $0.7490, followed by $0.8258 and $0.8734.
- Support Levels: Strong at $0.6085 and $0.5457; the 50 EMA at $0.6007 provides dynamic support.
- RSI (Relative Strength Index): Currently at 56.79, signaling room for further price recovery.
If SAND breaks above $0.7490, it could pave the way for a retest of its recent highs near $0.8734. However, a decline below the 50 EMA may signal a deeper pullback toward the $0.5457 support level. Volume remains a critical metric to watch, as strong trading activity will be needed to sustain upward momentum.

Sidebar rates
Related Posts
Add 3440

