


The Sandbox (SAND) Price Prediction: 80% Weekly Surge Targets $0.8258 Resistance
The Sandbox (SAND/USD) is still on a tear at $0.6479, up 7.46% in the last 24 hours.
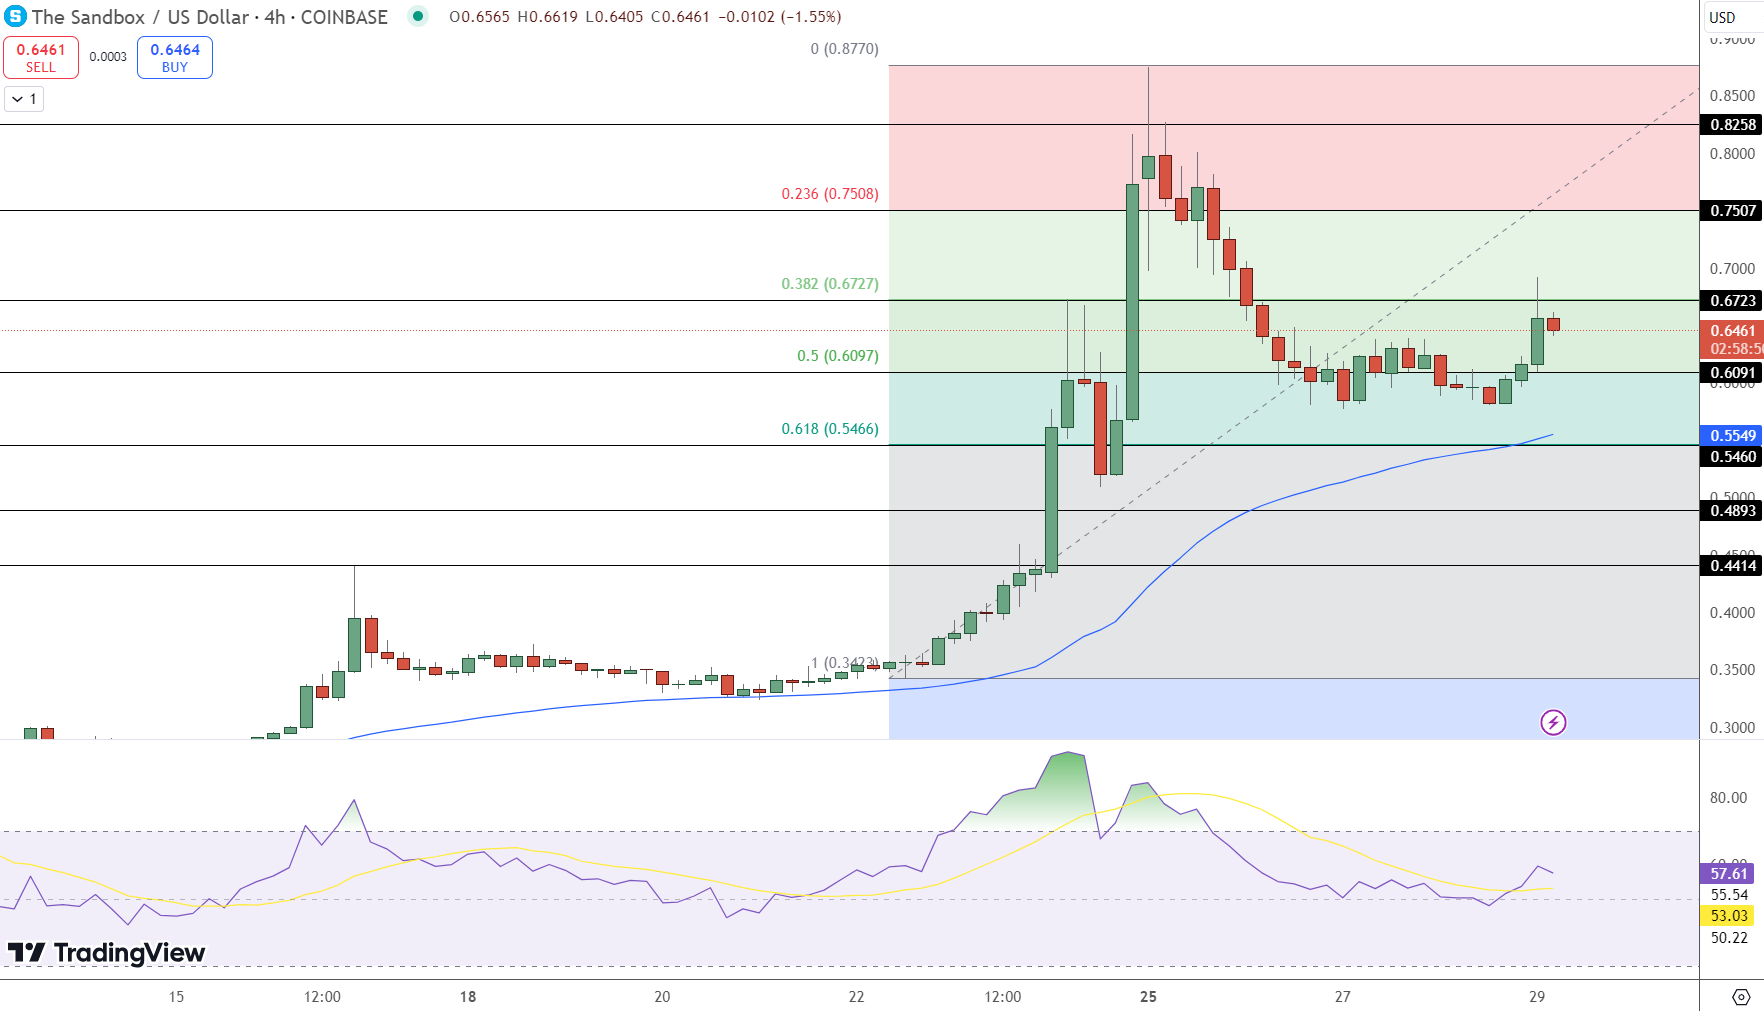
With an 80% 7 day surge the token is getting a lot of attention. 24 hour volume is $872 million, people are buying. SAND has retraced to the 50% fib at $0.6097 and is consolidating after taking profits.
Despite the retracement SAND is still above the critical support at $0.5466 which is the 61.8% fib. This level has been a base for the bullish sentiment and the market dynamics.
SAND Key Resistance Levels Signal Next Targets
On the upside, first resistance is at $0.6727 which is the 38.2% fib. Breaking this could lead to a retest of $0.7508 and $0.8258. These levels will be key to see if SAND can continue to go up.
On the downside, a break below the 50 day EMA at $0.5549 or $0.5466 fib could trigger a deeper correction to $0.4893. Watch these levels to see risk and momentum.
Technical Indicators Support Continued Gains
RSI is at 57 which is moderate bullish. SAND is not overbought yet and has room to go up if the market conditions are good. The move above the $0.6097 pivot is bullish and shows buyers are in control.
To continue the uptrend SAND needs to clear resistance with volume. A break above $0.6727 will confirm buying is back and will open up more room to go up.
Failure to hold the key support levels will shift the momentum and could lead to consolidation or a correction.
Key Insights
Bullish Momentum: SAND surges 7.46% in 24 hours, with an 80% weekly gain.
Key Resistance Levels: Critical resistance at $0.6727, $0.7508, and $0.8258.
Support Levels: Strong support at $0.6097 and $0.5466; 50-day EMA aligns at $0.5549.


Sidebar rates
Related Posts
Add 3440

