Tesla Stock Surges 160% in 8 Months, Approaching ATH with Potential for Further Gains

Tesla’s stock has staged a remarkable recovery over the past eight months, showing significant momentum, particularly in November 2024. This resurgence follows a prolonged two-year corrective phase, which served to consolidate gains after the stock’s previous parabolic growth.
The current rally reflects renewed investor confidence, driven by Tesla’s advancements in EV production, Full Self-Driving technology, and energy solutions. The question now arises: is Tesla poised to break through its previous all-time high?
Tesla (TSLA) Stock Targets All-Time High of $414.5 After Recent Surge
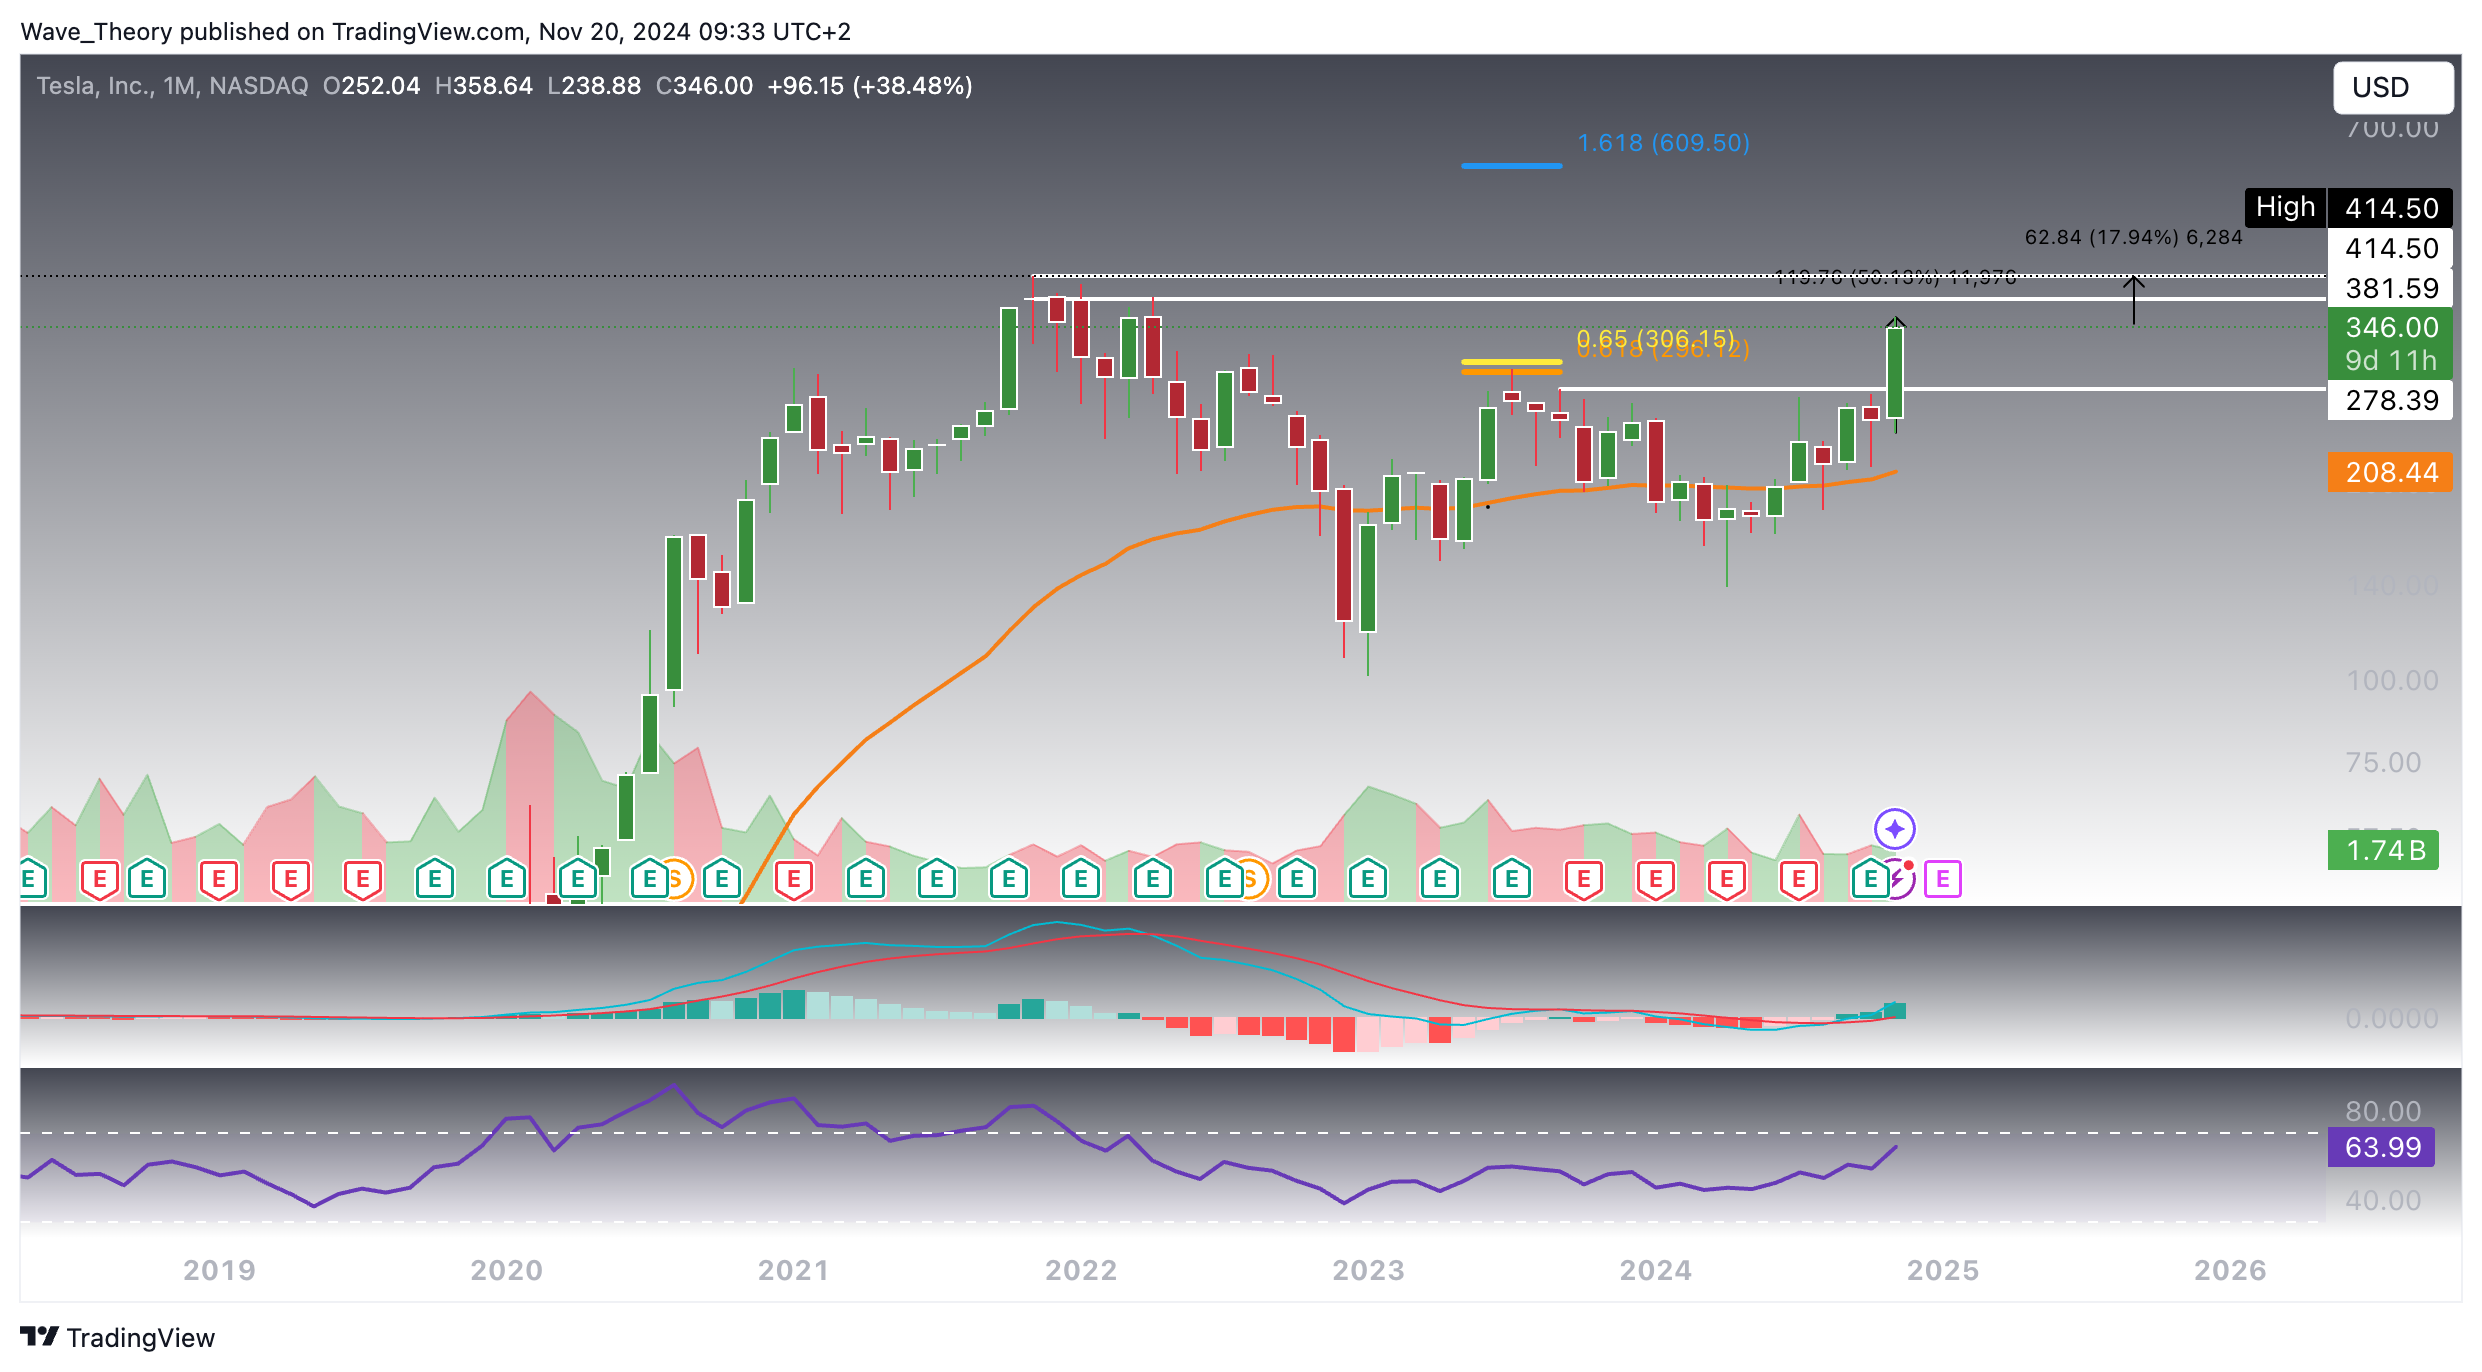
Tesla stock has experienced a meteoric rise, climbing approximately 160% over the last eight months and surging by an impressive 50% this month alone. This upward momentum enabled Tesla to decisively break through the golden ratio resistance at $306, a level where it had faced bearish rejection nearly two years ago. This breakout marks a pivotal shift in the stock’s technical structure, paving the way for a potential re-test of the all-time high (ATH) resistance zone between $381 and $414.5, representing an additional 18% upside potential from current levels.
Should Tesla successfully overcome this resistance, the next significant target emerges at the Fib projection level of $609.5. Beyond this point, resistance becomes sparse, leaving Tesla with open-ended upside potential, contingent on strong buying pressure and continued momentum. The stock’s trajectory will be closely watched, as breaking the ATH could solidify its position in uncharted territory, potentially driving further speculative interest and long-term investor confidence.
Moreover, the monthly chart indicators reinforce the bullish outlook for Tesla stock. The RSI remains in neutral territory, suggesting ample room for further upward movement without signaling overbought conditions. Simultaneously, the MACD lines have crossed bullishly, an encouraging sign of sustained upward momentum. The MACD histogram also exhibits a steady upward trend, reflecting strengthening bullish sentiment over longer timeframes. These signals collectively align with the stock’s breakout trajectory, bolstering the potential for further gains in the coming months.

Tesla Stock Shows Impressive Growth Over Recent Weeks: Is It Set for More?
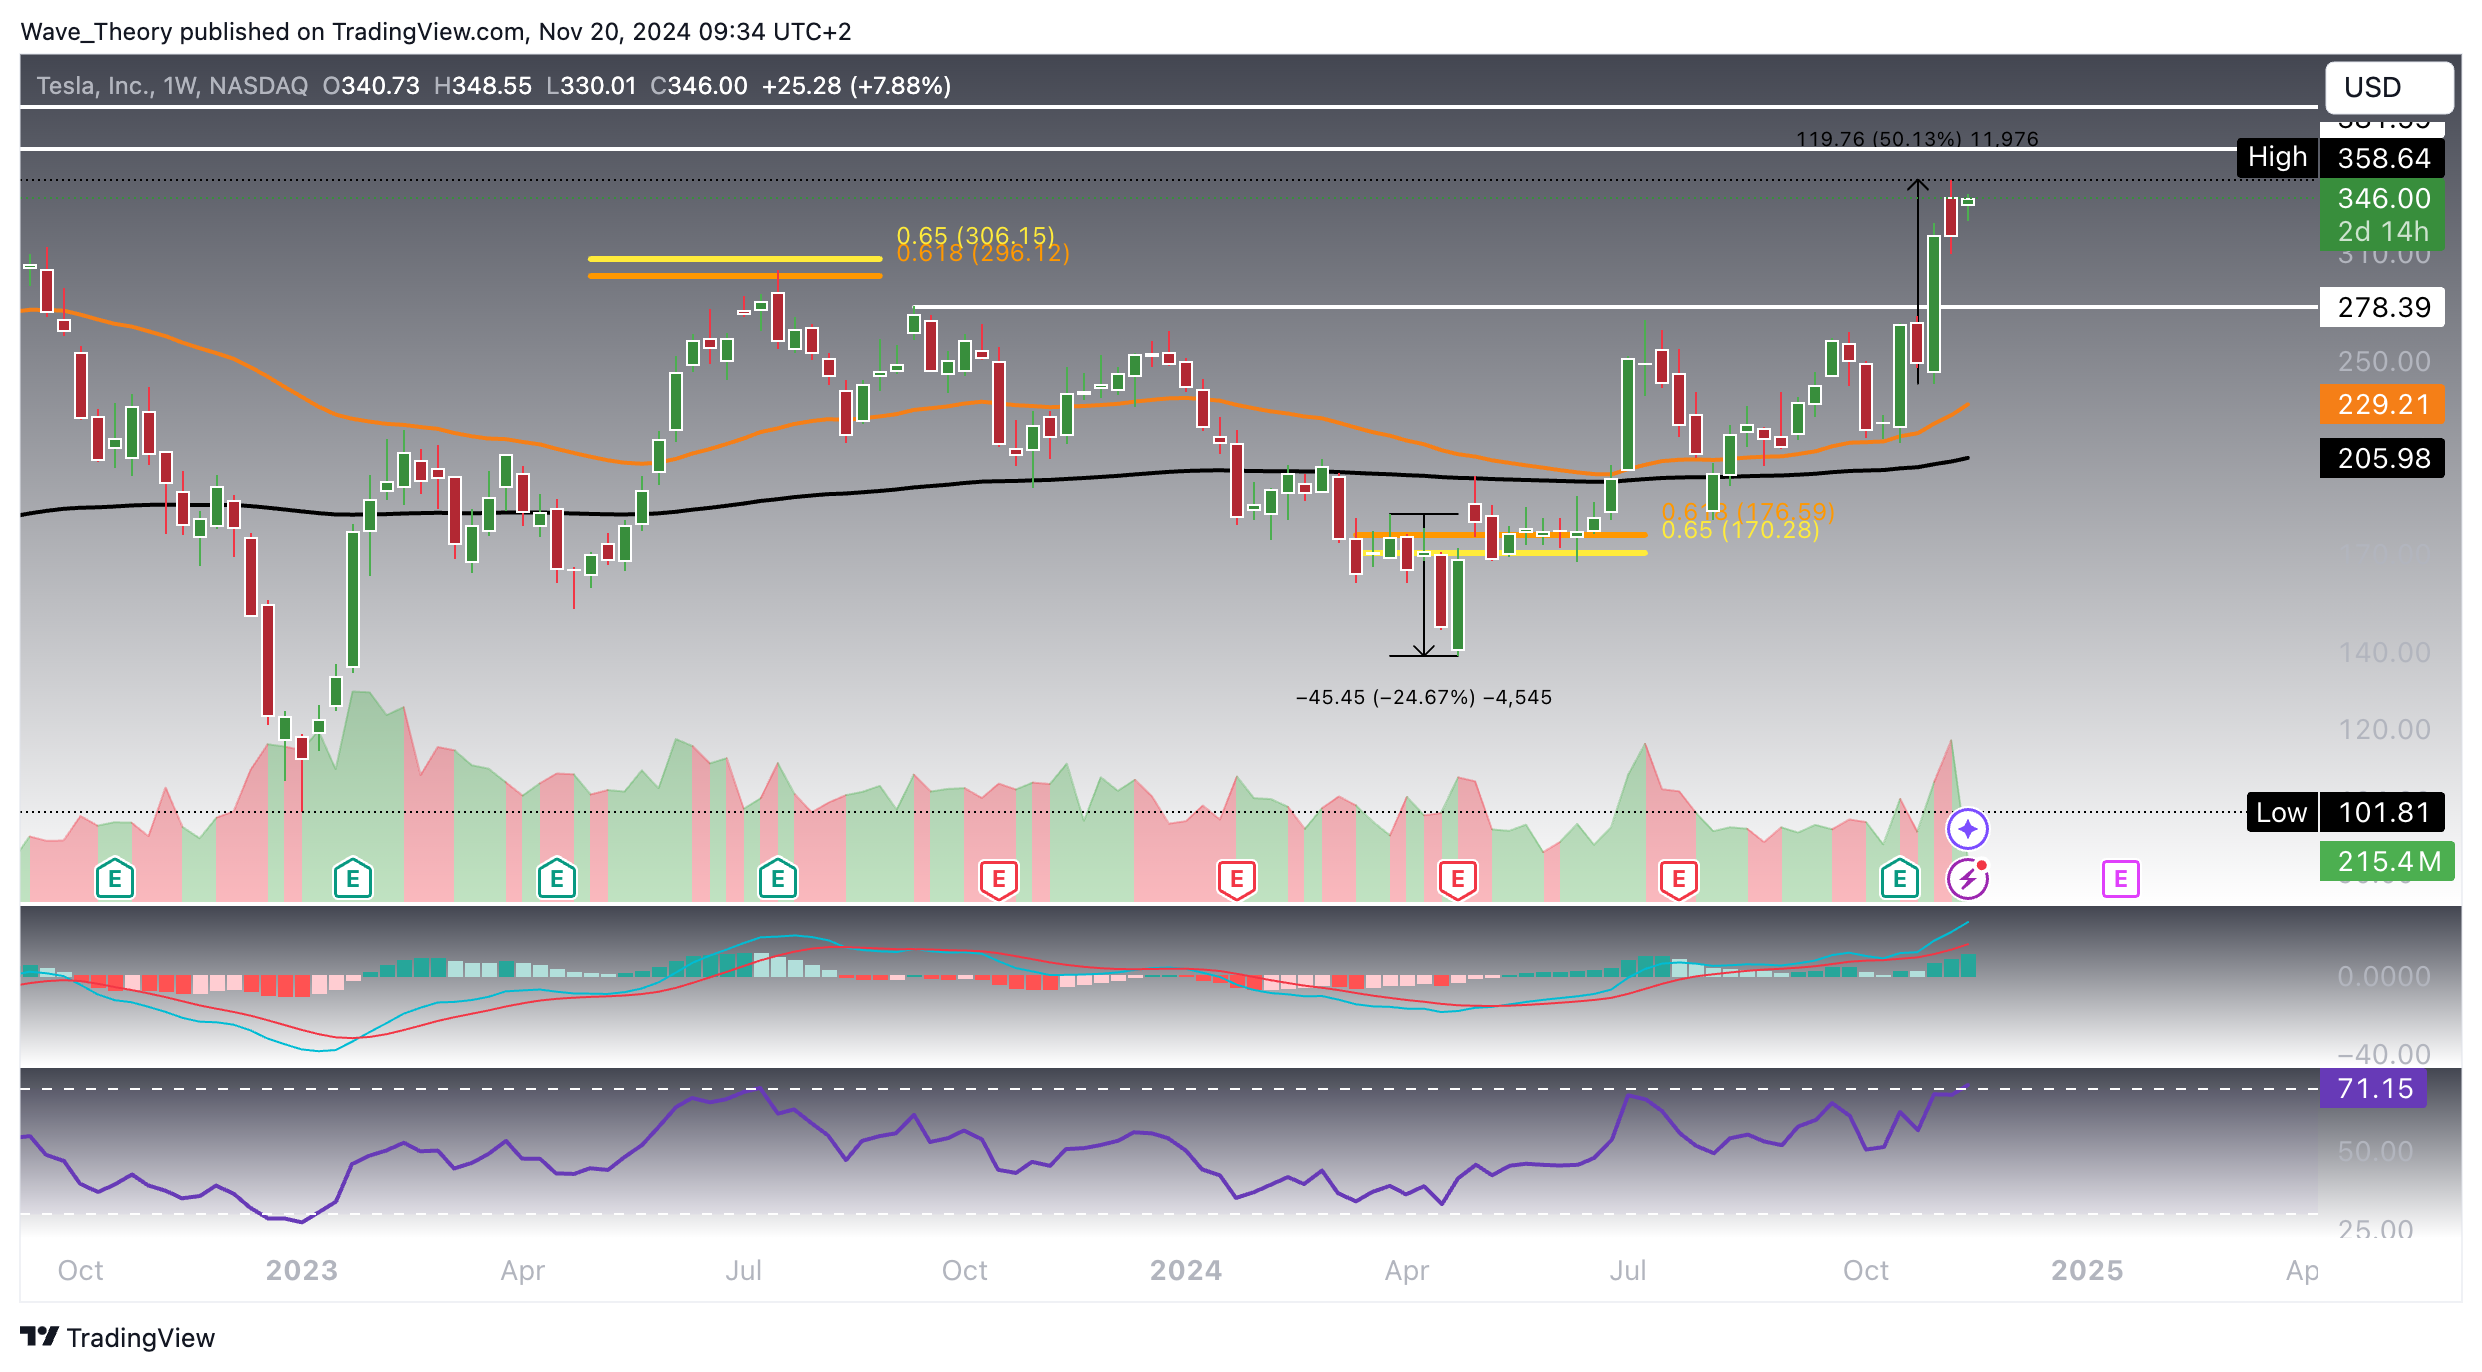
In May 2024, Tesla broke below the golden ratio support at $170, declining by approximately 25%. However, the stock demonstrated resilience, recovering rapidly over the following two months. This recovery nullified the bearish breakout, marking it as a false breakdown. Since then, Tesla has successfully held above this crucial support, reinforcing its bullish structure.
Over the last three weeks, Tesla has breached several key resistance levels, setting the stage for further upward momentum. The weekly chart indicators align with this positive outlook. The MACD lines and EMAs have crossed bullishly, confirming the mid-term bullish trend. Furthermore, the MACD histogram has been ticking higher, signaling strengthening momentum. Meanwhile, the RSI flirts with overbought territory but remains free of bearish divergence, suggesting the uptrend has room to continue.
These technical developments position Tesla for potential further gains, with its breakout indicating robust market interest and bullish sentiment.

Daily Chart of Tesla (TSLA) Reveals Mixed Signals Amid Bullish Momentum
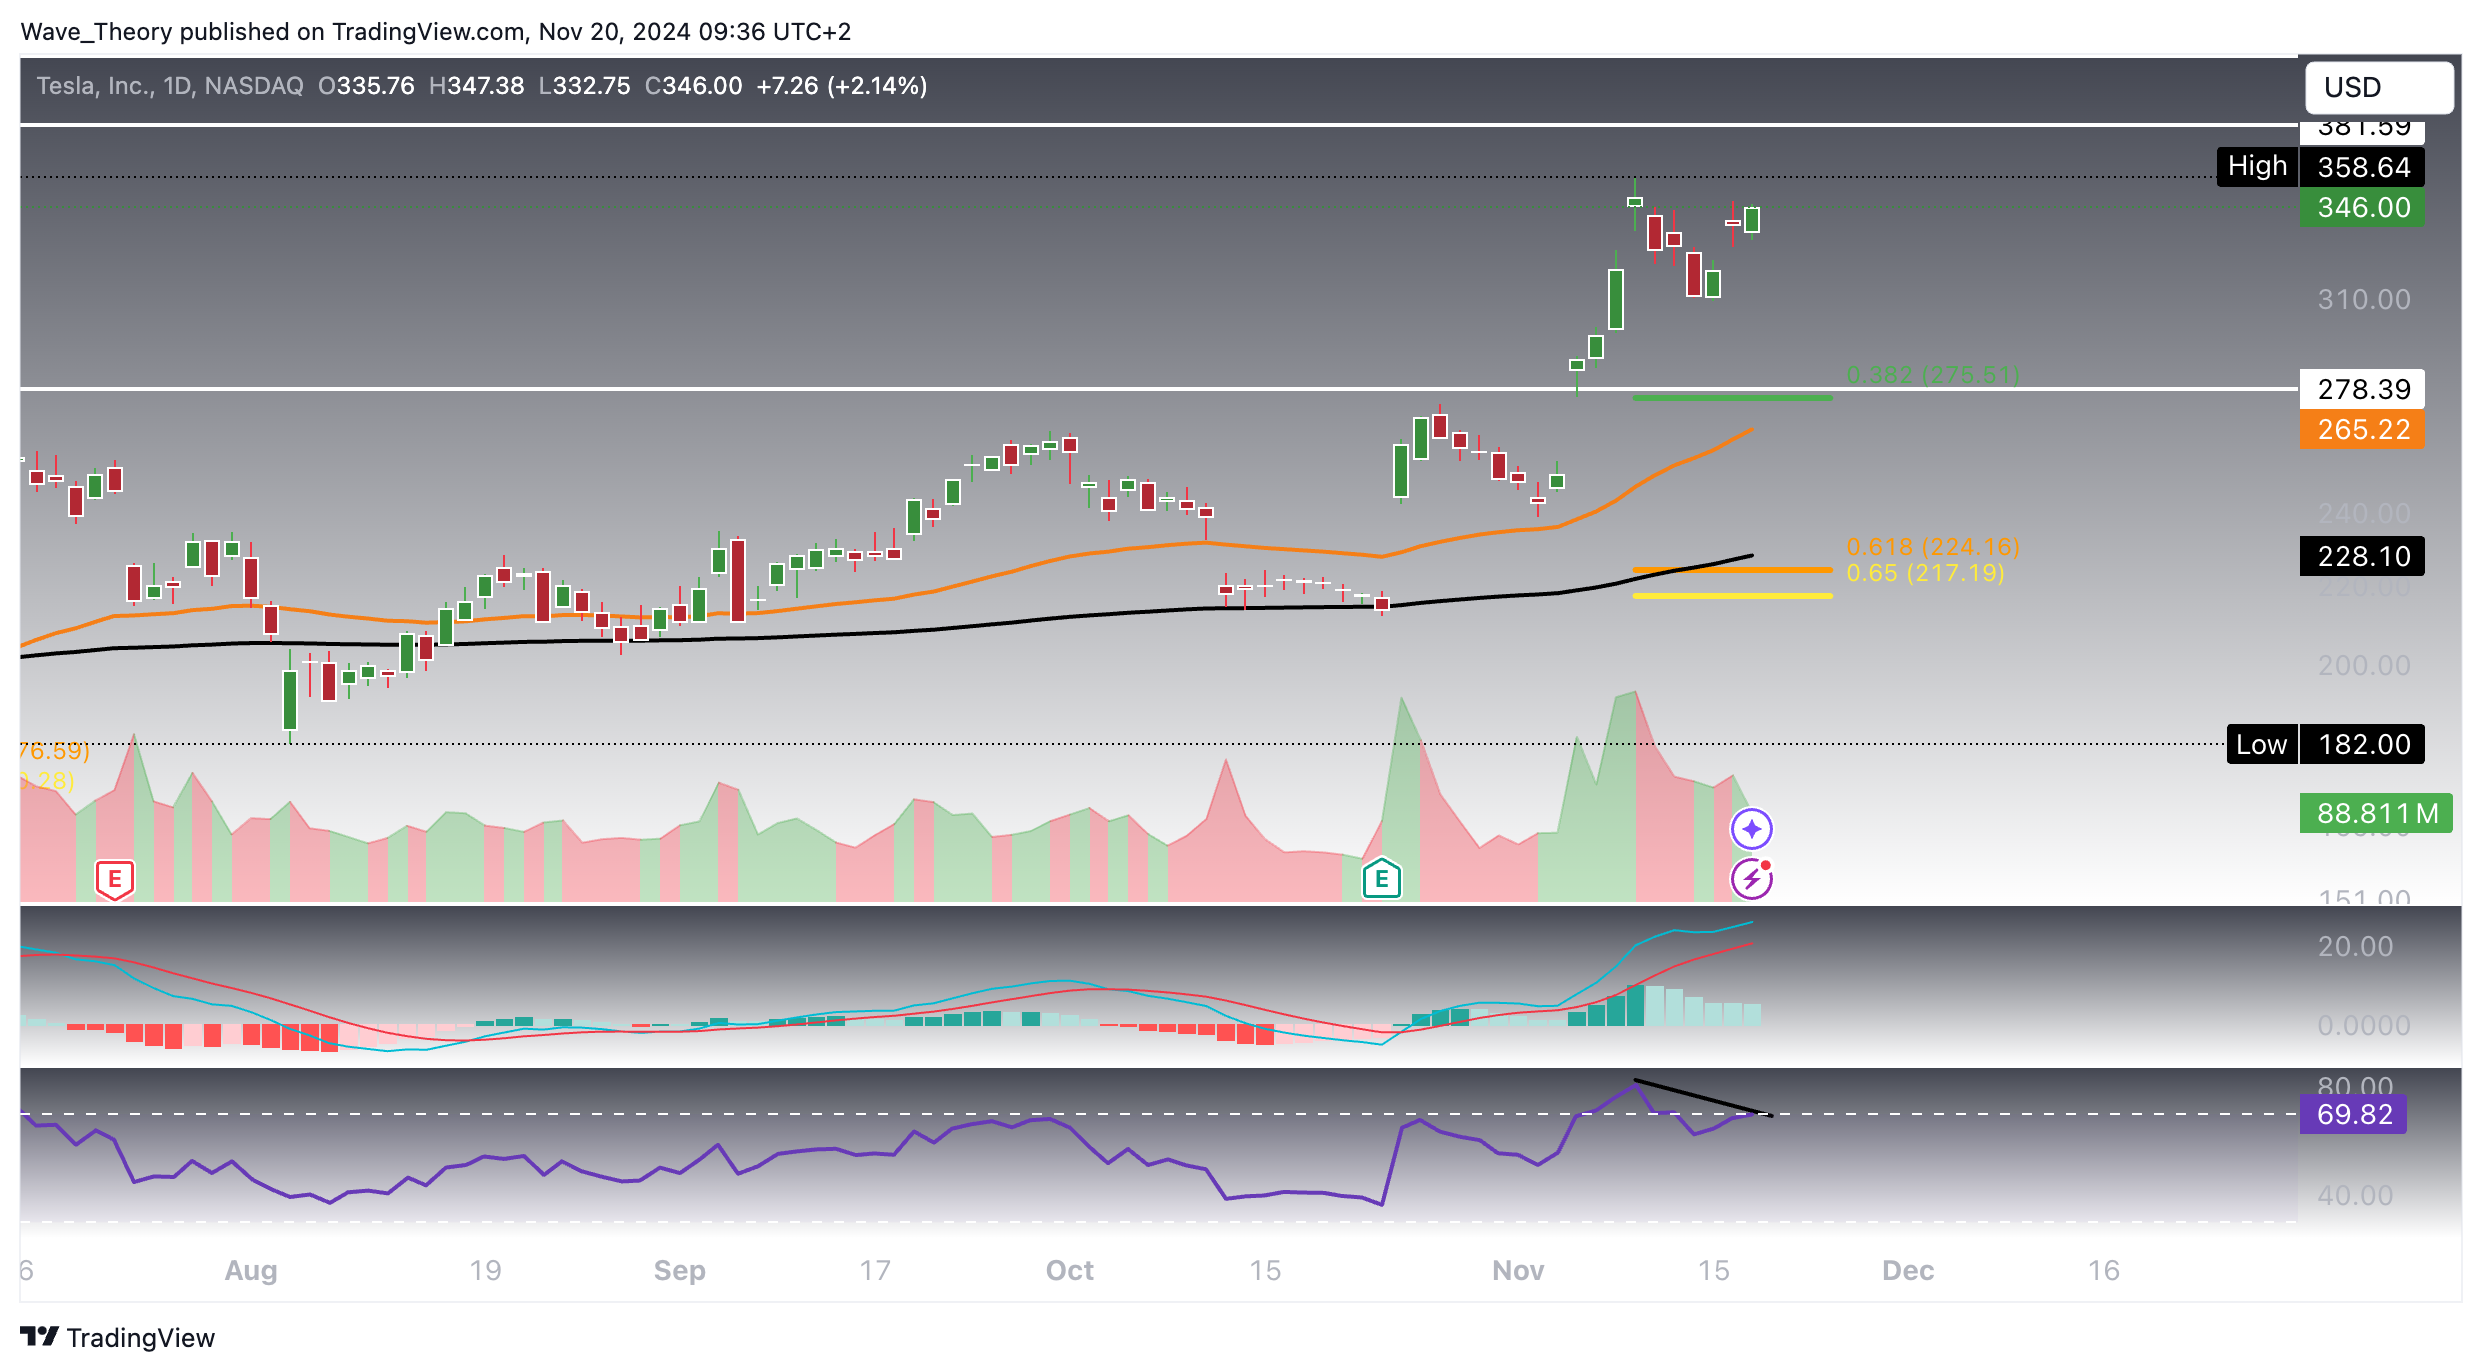
In the daily chart, Tesla’s indicators present mixed signals. On the bullish side, the EMAs maintain an intact golden crossover, confirming a bullish trend in the short- to medium-term. Additionally, the MACD lines are crossed bullishly, further supporting upward momentum.
However, there are some cautionary signs. The MACD histogram has been ticking bearishly lower for almost a week, signaling a potential weakening of momentum. Furthermore, the RSI is bordering overbought territory, and there is a risk of forming a bearish divergence if the stock’s price exceeds the last high of $358.64.
If Tesla enters a correction phase, there are several significant support levels to watch. The Fibonacci support levels are found at $275.5 and $217, while the 200-day EMA offers additional support at $228 and the 50-day EMA provides support at $265. These levels could act as critical areas to prevent further downside.

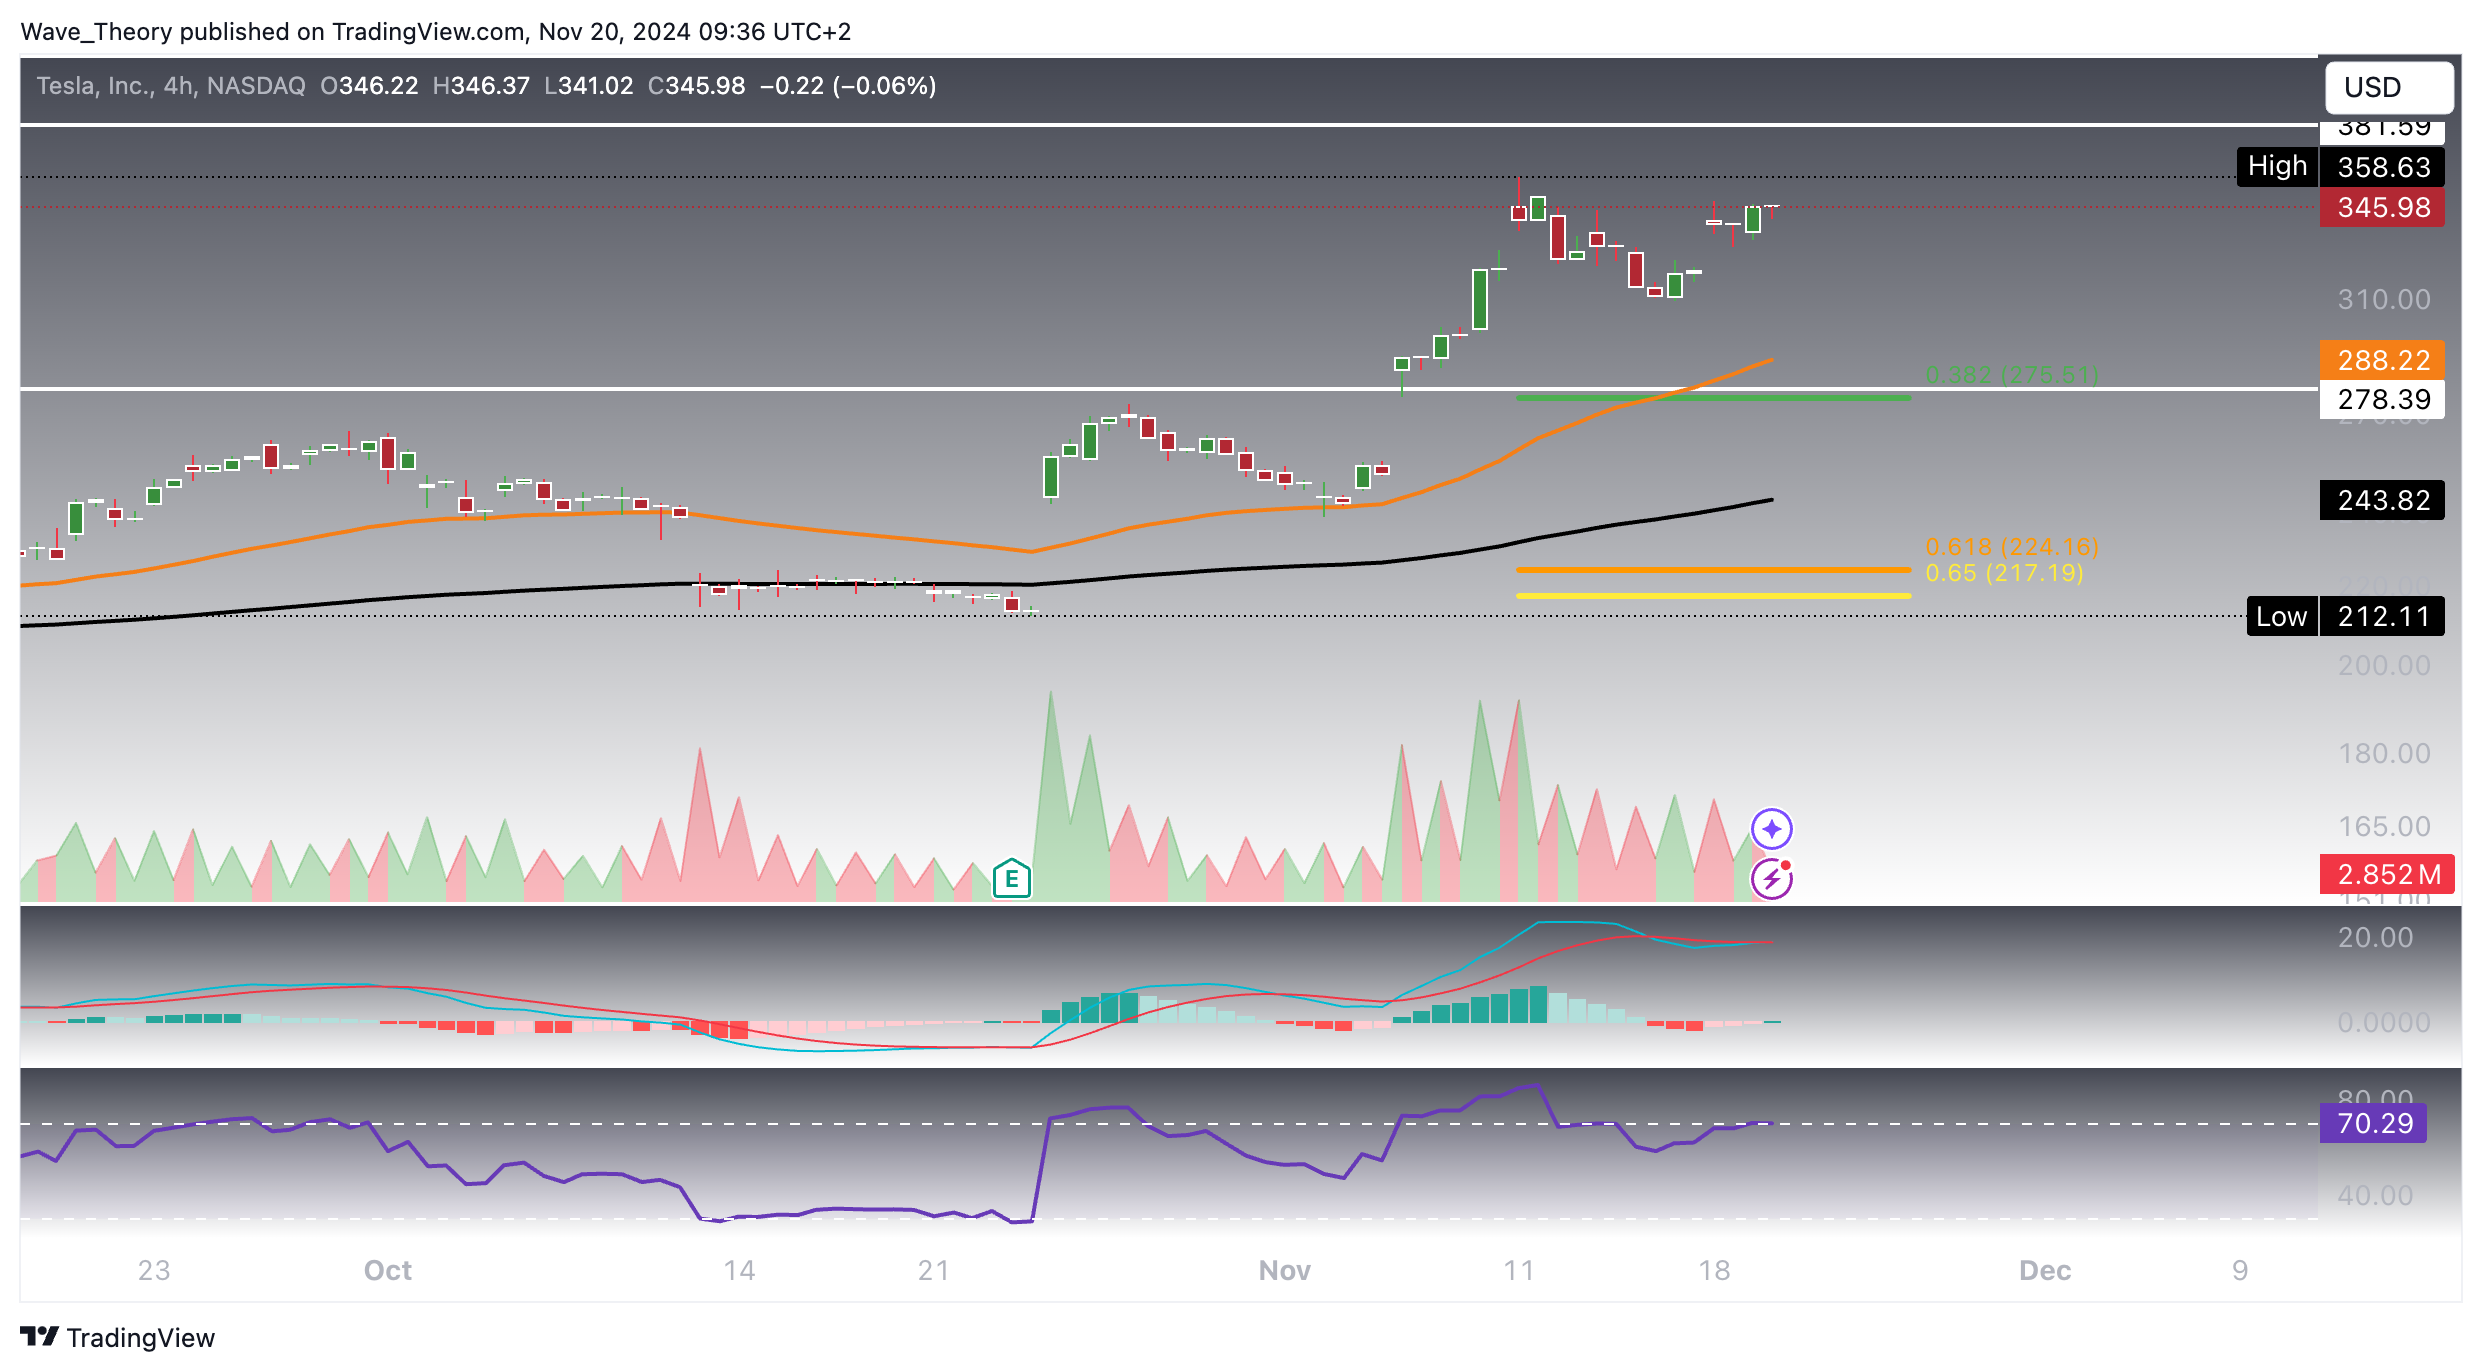
Tesla Stock Trend Remains Bullish: Short-Term Outlook Still Positive
However, some potential warning signs are emerging. The MACD lines appear to be on the verge of crossing bearishly, which could suggest a weakening in the upward trend. Additionally, the RSI is approaching overbought regions, and there’s a possibility of forming a bearish divergence, which could signal an impending pullback or correction.
These mixed signals suggest that while the short-term outlook remains bullish, caution is warranted, especially if bearish divergences in the RSI materialize or if the MACD confirms a bearish crossover.

- Check out our free forex signals
- Follow the top economic events on FX Leaders economic calendar
- Trade better, discover more Forex Trading Strategies
- Open a FREE Trading Account


