Forex Signals Brief September 17: Canada Inflation and US Retail Sales
Yesterday’s economic calendar may have been light, while today we have the US retail sales and Canadian CPI inflation. However, there was still notable action. USD/JPY broke below the 140.00 mark, plunging to a 2024 low of 135.60 in early European trading before bouncing back. The pair managed to recover throughout the US session, reaching 140.90, with most of the gains coming after the release of a strong NY Empire Fed Manufacturing Index. The index surged to 11.5 points, marking its first return to expansion territory since November 2023.

While USD/JPY made a remarkable recovery, the US dollar struggled to attract bids elsewhere. It is expected to end the day near lows against both the British pound and the Australian dollar, while the euro traded near the top of its daily range. Market sentiment remains focused on the upcoming interest rate decision, with heated debates about whether the Fed will hike by 25 or 50 basis points. The probability for a 50bps hike is currently at 65%, but all eyes are on potential leaks from the Wall Street Journal for further clues.
Today’s Market Expectations
The Canadian CPI year-over-year (Y/Y) is forecasted to be 2.1%, down from 2.5% previously, while the month-over-month (M/M) figure is expected to remain flat at 0.0%, down from 0.4%. Focus remains on underlying inflation metrics, with the Trimmed Mean CPI Y/Y predicted to be 2.5% (down from 2.7%) and the Median CPI Y/Y expected at 2.3% (slightly down from 2.4%). The Bank of Canada is anticipated to cut interest rates by 25 basis points at its last two meetings of the year. However, there is a possibility of more aggressive cuts if GDP and inflation data disappoint, as indicated by Governor Macklem last week.
For the US, Retail Sales M/M are forecasted to be 0.2%, down from 1.0%, while Ex-Autos M/M is expected at 0.3%, down slightly from 0.4%. The Control Group figure is projected at 0.2%, a decrease from 0.3%. Despite these lower expectations, consumer spending has remained steady, supported by robust real wage growth and a strong labor market. Furthermore, the University of Michigan (UMich) Consumer Sentiment Index has been steadily increasing, indicating that consumers’ financial situations are either stable or improving.
yesterday we started it well with a winning forex signal in AUD/USD longs, as the Aussie pushed higher despite weaker Chinese data over the weekend. However, we got caught by the USD decline during the European session, however we made up during the US session. We opened 7 trading signals in total, ending the day with 4 winning forex signals and three losing signals.
Gold Holds Above the 20 Daily SMA
The upward momentum in gold continues as buyers push the price to new record highs nearly every day, driven by expectations of a Federal Reserve rate cut. Gold reached an all-time high of $2,589 last week and is up another 0.3% today. With the Federal Reserve’s meeting on the horizon, the precious metal is likely to maintain its bullish trend, benefiting from its role as a safe-haven asset while the US dollar weakens under rate drop forecasts.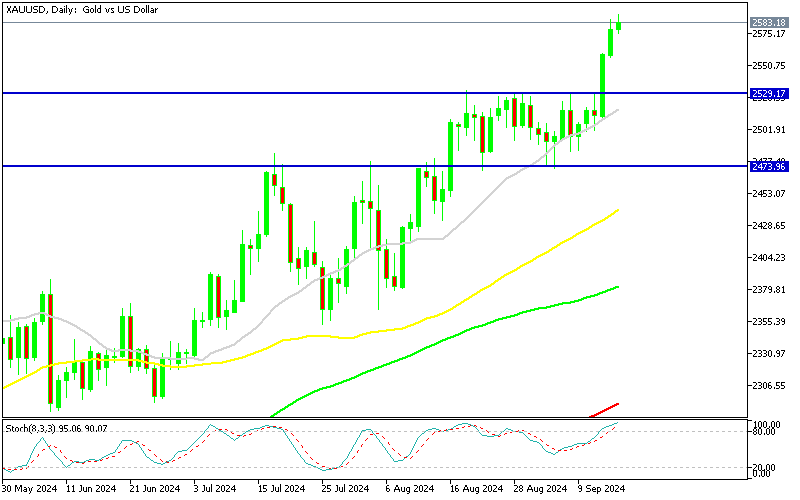
XAU/USD – Daily chart
EUR/USD Continues Climb Above 1.11
After falling two cents from its August peak, EUR/USD has recovered as sellers failed to break the critical 1.10 level. The 100 SMA on the H4 chart provided a major support zone where the pair consolidated for several sessions. Despite recent rate cuts, the Euro has remained resilient, supported by ECB policymakers’ commitment to a gradual monetary easing approach. The rise in EUR/USD is primarily driven by the expectation that the Federal Reserve will aggressively loosen its monetary policy, weakening the USD.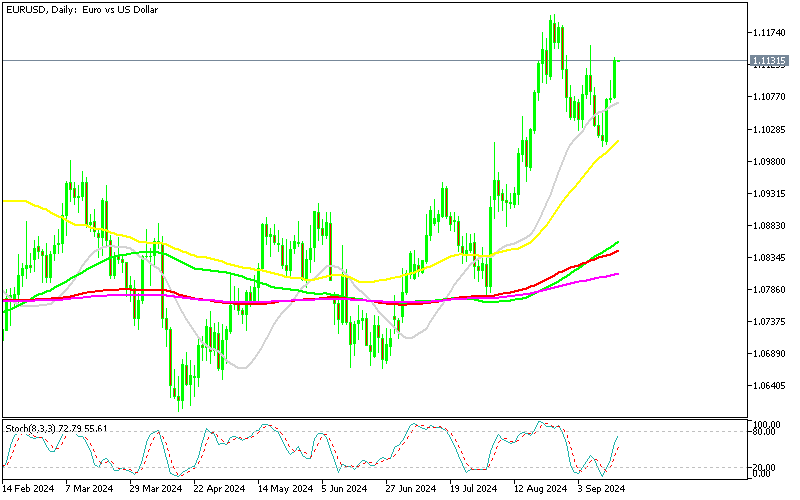
EUR/USD – Daily Chart
Cryptocurrency Update
Bitcoin Reverses Lower Below $60,000

BTC/USD – Daily chart
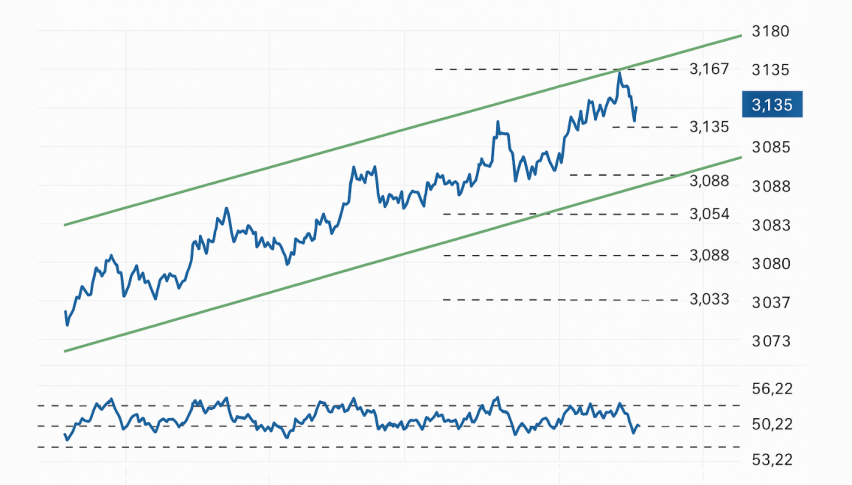
Ethereum Returns to the 100 SM
Ethereum has been in a persistent downtrend since March. After a sharp fall from $3,830 to below $3,000 in June, the cryptocurrency briefly rallied above its 50-day moving average before facing renewed selling pressure that pushed it below $2,200. Despite this, strong support emerged at that level, and last week Ethereum bounced off the 100-week SMA, producing a bullish candlestick. This suggests renewed buyer interest and hints at the potential for a reversal in the ongoing bearish trend.
ETH/USD – Daily chart


Sidebar rates
Related Posts
