


USDJPY Claims Some of Last Week’s Losses After Mixed Durables
The USD/JPY trend has shifted since July, with the currency pair moving lower last week after a brief retracement higher. This decline confirms its negative bias and the resumption of the downtrend. The shift is largely due to diverging monetary policies from the Federal Reserve and the Bank of Japan, as highlighted by Fed Chair Jerome Powell’s remarks at the Jackson Hole Symposium and BOJ Governor Kazuo Ueda’s address to Japan’s National Diet.
USD/JPY Chart H4 – Sellers Remain in Control, Aided by MAs
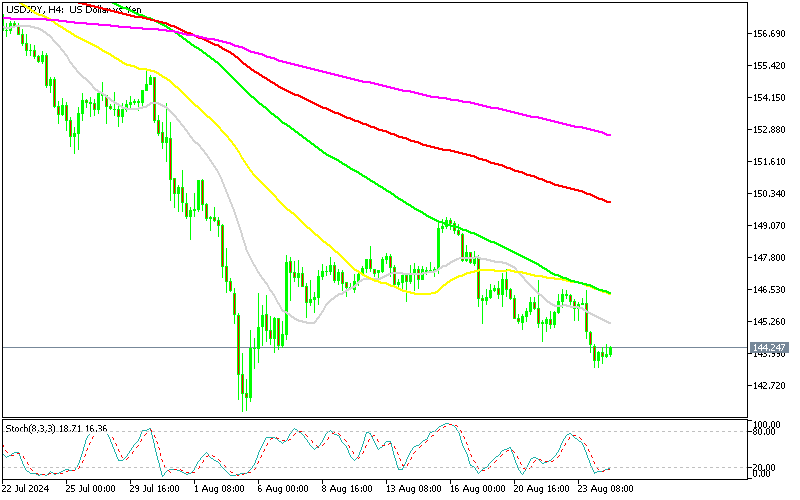
The Fed has moved towards loosening monetary policy, starting with a rate cut expected in September. In contrast, the Bank of Japan has tightened its policy stance, raising interest rates by 15 basis points at its most recent meeting. As a result, the intraday bias in USD/JPY remains to the downside, with the pair expected to retest the recent low of 141.67.
However, on shorter timeframes, USD/JPY has been retracing higher today, though the strength of this retracement appears weak. In response, a decision was made to issue a sell signal for USD/JPY above 144. This decision is supported by underlying components of the US Retail Sales report for July, which revealed signs of weakness, including downward revisions for June. Despite a jump in the headline figure, driven mainly by the auto component, the overall report suggests softening consumer demand, adding further pressure on USD/JPY.
US durable goods orders for July 2024

- US July Durable Goods Orders: Increased significantly by 9.9%, far exceeding the expected rise of 5.7%. This strong performance indicates a robust rebound in demand for long-lasting manufactured goods.
- June Durable Goods Orders: Had previously declined by 6.7%, highlighting a sharp turnaround in July’s figures.
- New Orders for Manufactured Durable Goods: Jumped to $289.6 billion in July, reversing the decline seen in June. This substantial increase underscores a significant resurgence in manufacturing activity.
- Transportation Equipment Orders: Skyrocketed by 34.8% to $102.2 billion, driving the overall increase in durable goods orders. This sector played a key role in the overall growth, indicating strong demand for transportation-related goods.
- Durable Goods Orders Excluding Transportation: Decreased by 0.2%, slightly below the expected 0.1% drop. This shows that outside the transportation sector, demand was weaker.
- Previous Ex-Transportation Orders: Initially reported as a 0.4% increase, revised down to a 0.1% gain, indicating softer demand than initially thought.
- New Orders Excluding Defense: Rose 10.4% in July, a strong rebound from the prior month’s decline of 7.2% (revised to -7.5%). This suggests robust growth in non-defense sectors.
- Nondefense Capital Goods Orders (Excluding Aircraft): Slightly decreased by 0.1%, compared to the expected flat growth of 0.0%. This indicates a minor drop in business investment in capital goods.
- Previous Nondefense Capital Goods Orders: Had risen by 0.9%, but this was revised down to a 0.5% increase, showing a softer trend in business equipment spending.
- Unfilled Orders: Increased by 0.2% to $1,386.5 billion, marking the 47th increase in the past 48 months. This indicates a continued backlog in manufacturing orders, reflecting sustained demand.
- Inventories: Inched up by 0.1% to $529.7 billion, suggesting that inventory levels are being managed carefully despite the strong increase in new orders.
Core orders continue to show signs of weakness and have been subject to downward revisions in prior reports. While the overall durable goods orders report appears strong, much of this strength is due to the volatile transportation sector, which masks underlying softness in other areas. Despite this, the decline in core orders isn’t significant, indicating that the underlying weakness is moderate rather than severe. It’s also important to note that this report has offered limited clarity on economic trends since the pandemic began, making it challenging to draw firm conclusions about the broader economic outlook.
USD/JPY Live Chart


Sidebar rates
Add 3442

Related Posts
Add 3440

