Gold Hits $2,383; Fed Rate Cut & FOMC Key Influencers
As of the latest trading session, Gold (XAU/USD) has marked a modest climb, reaching an intra-day high of $2,383, and is presently

As of the latest trading session, Gold (XAU/USD) has marked a modest climb, reaching an intra-day high of $2,383, and is presently stabilizing around $2,379.
This upward movement is largely attributed to anticipations that the Federal Reserve may implement a rate cut in its September meeting, consequently diminishing US Treasury bond yields. This economic mechanism weakens the US Dollar, subsequently enhancing the attractiveness of gold as an investment.
Geopolitical Tensions Enhance Safe-Haven Appeal
The ongoing geopolitical unrest in the Middle East continues to underpin gold’s status as a safe-haven asset. Despite this, the potential for significant price surges remains checked by the positive sentiments prevailing within global equity markets, which tend to divert investment away from traditional safe-havens such as gold.
FOMC Meeting and Key Economic Indicators Awaited
Investors remain on edge as the financial landscape braces for the outcomes of the Federal Open Market Committee (FOMC) meeting concluding this Wednesday. Additionally, pivotal US economic indicators, including the Nonfarm Payrolls (NFP) report due at the month’s start, are expected to play crucial roles in dictating the subsequent market trajectory for gold.
US Economic Data Influences Gold Prices
The weakening of the US dollar continues as it struggled to gain ground following the release of the US Personal Consumption Expenditures (PCE) Price Index, which indicated only modest inflation growth in June. The report, which showed a 0.1% increase in June and an annual rise of 2.5%, suggests a cooling of inflationary pressures. This data reinforces expectations for forthcoming Federal Reserve rate cuts, propelling further declines in US Treasury yields—most notably, the 10-year note which sank to a near two-week low. These dynamics provide a conducive environment for gold, driving its prices upward as investors lean towards the non-yielding asset amidst lower yield prospects.
In conclusion, XAU/USD’s trajectory is being shaped by a confluence of economic data, Fed policy expectations, and geopolitical developments. The upcoming economic events and data releases will be critical in determining the direction of gold prices in the near term, as market participants gauge the balance between emerging global economic trends and prevailing uncertainties.
In conclusion, XAU/USD’s trajectory is being shaped by a confluence of economic data, Fed policy expectations, and geopolitical developments. The upcoming economic events and data releases will be critical in determining the direction of gold prices in the near term, as market participants gauge the balance between emerging global economic trends and prevailing uncertainties.
Gold Price Forecast
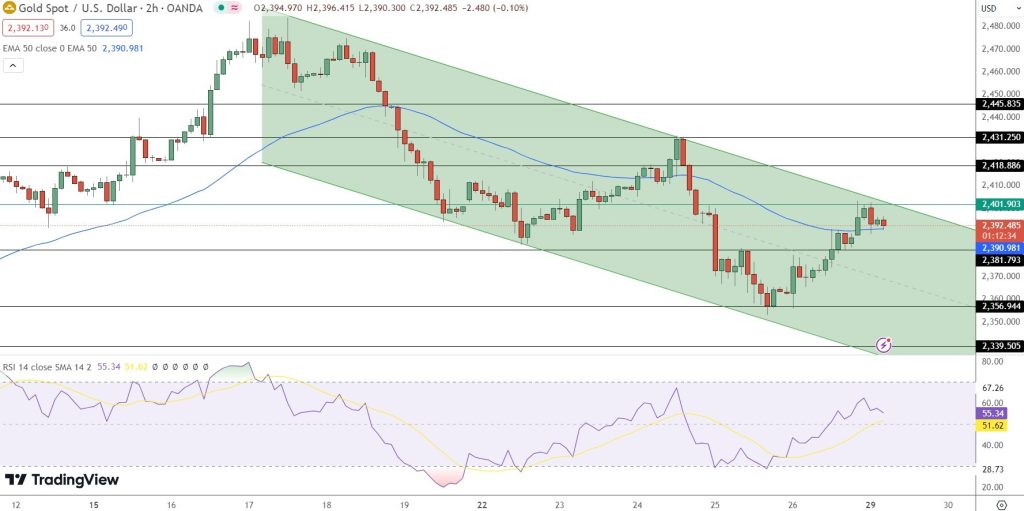
The current price of Gold Spot is $2,392.13, according to the 2-hour chart. Key price levels to watch include a pivot point at $2,401.90. The immediate resistance is positioned at $2,418.89, with subsequent resistance at $2,431.25. Support levels are identified at $2,381.79 and further down at $2,356.94.
In terms of technical indicators, the Relative Strength Index (RSI) is at 55.34, which indicates a neutral market momentum without signs of being overbought or oversold. The 50-day Exponential Moving Average (EMA) stands at $2,390.98, slightly below the current price, highlighting a mild downward trend. This EMA aligns with the upper resistance of the descending channel, suggesting that the $2,400 level is a significant barrier.
- Check out our free forex signals
- Follow the top economic events on FX Leaders economic calendar
- Trade better, discover more Forex Trading Strategies
- Open a FREE Trading Account
Related Articles

Comments
Sidebar rates
Related Posts
