Gold Hits $2,418 as U.S. Economic Uncertainty Fuels Rally
Gold prices have ascended to new heights, reaching a daily peak of $2,418.44, up from a stable position around $2,414.06.
| Broker | Review | Regulators | Min Deposit | Website | |
|---|---|---|---|---|---|
| 🥇 |  | Read Review | FCA, CySEC, ASIC, MAS, FSA, EFSA, DFSA, CFTC | USD 100 | Visit Broker |
| 🥈 | Read Review | FSCA, FSC, ASIC, CySEC, DFSA | USD 5 | Visit Broker | |
| 🥉 |  | Read Review | CySEC, MISA, FSCA | USD 25 | Visit Broker |
| 4 |  | Read Review | ASIC, BaFin, CMA, CySEC, DFSA, FCA, SCB | USD 200 | Visit Broker |
| 5 |  | Read Review | ASIC, FCA, CySEC, SCB | USD 100 | Visit Broker |
| 6 | Read Review | FCA, FSCA, FSC, CMA | USD 200 | Visit Broker | |
| 7 | Read Review | BVI FSC | USD 1 | Visit Broker | |
| 8 |  | Read Review | CBCS, CySEC, FCA, FSA, FSC, FSCA, CMA | USD 10 | Visit Broker |
| 9 |  | Read Review | ASIC, CySEC, FSCA, CMA | USD 100 | Visit Broker |
| 10 |  | Read Review | IFSC, FSCA, ASIC, CySEC | USD 1 | Visit Broker |
This upward movement in the gold market is attributed to a general shift towards safer investments and dovish sentiments from the Federal Reserve. As global stock markets show signs of strain, investors have increasingly turned to gold, a traditional safe-haven asset.
Concurrently, the weakening of the U.S. dollar, which has slid from its recent high, has also played a crucial role in bolstering gold prices. Speculation about potential rate cuts by the Federal Reserve in September, coupled with political shifts within the U.S., has further driven the dollar down and lifted gold.
Economic Indicators and Their Impact on Gold
Recent U.S. economic data have painted a picture of potential economic slowdown, which has been a boon for gold prices. The Federal Reserve Bank of Richmond highlighted a decline in manufacturing activity, with its index falling to -17 from -10 in the previous month.
Similarly, the National Association of Realtors reported a significant 5.4% drop in existing home sales, reaching the lowest sales pace since December at 3.89 million units annually, falling short of market forecasts.
These indicators not only suggest a softening economy but also heighten the possibility of the Federal Reserve implementing rate cuts, a scenario that typically enhances the allure of gold.
Looking Forward: Key Data Releases and Market Sentiment
Investors are on high alert, adopting a cautious stance as they await further clarity from upcoming U.S. economic reports. The spotlight is on the Advance U.S. Q2 GDP figures and the Personal Consumption Expenditures (PCE) Price Index, both due for release later this week. These figures are critical as they may influence the Federal Reserve’s policy decisions moving forward.
Additionally, the market is monitoring global Purchasing Managers’ Index (PMI) reports to gauge the health of the global economy. With these pivotal data points on the horizon, the gold market remains a focal point for traders looking for stability in uncertain economic times.
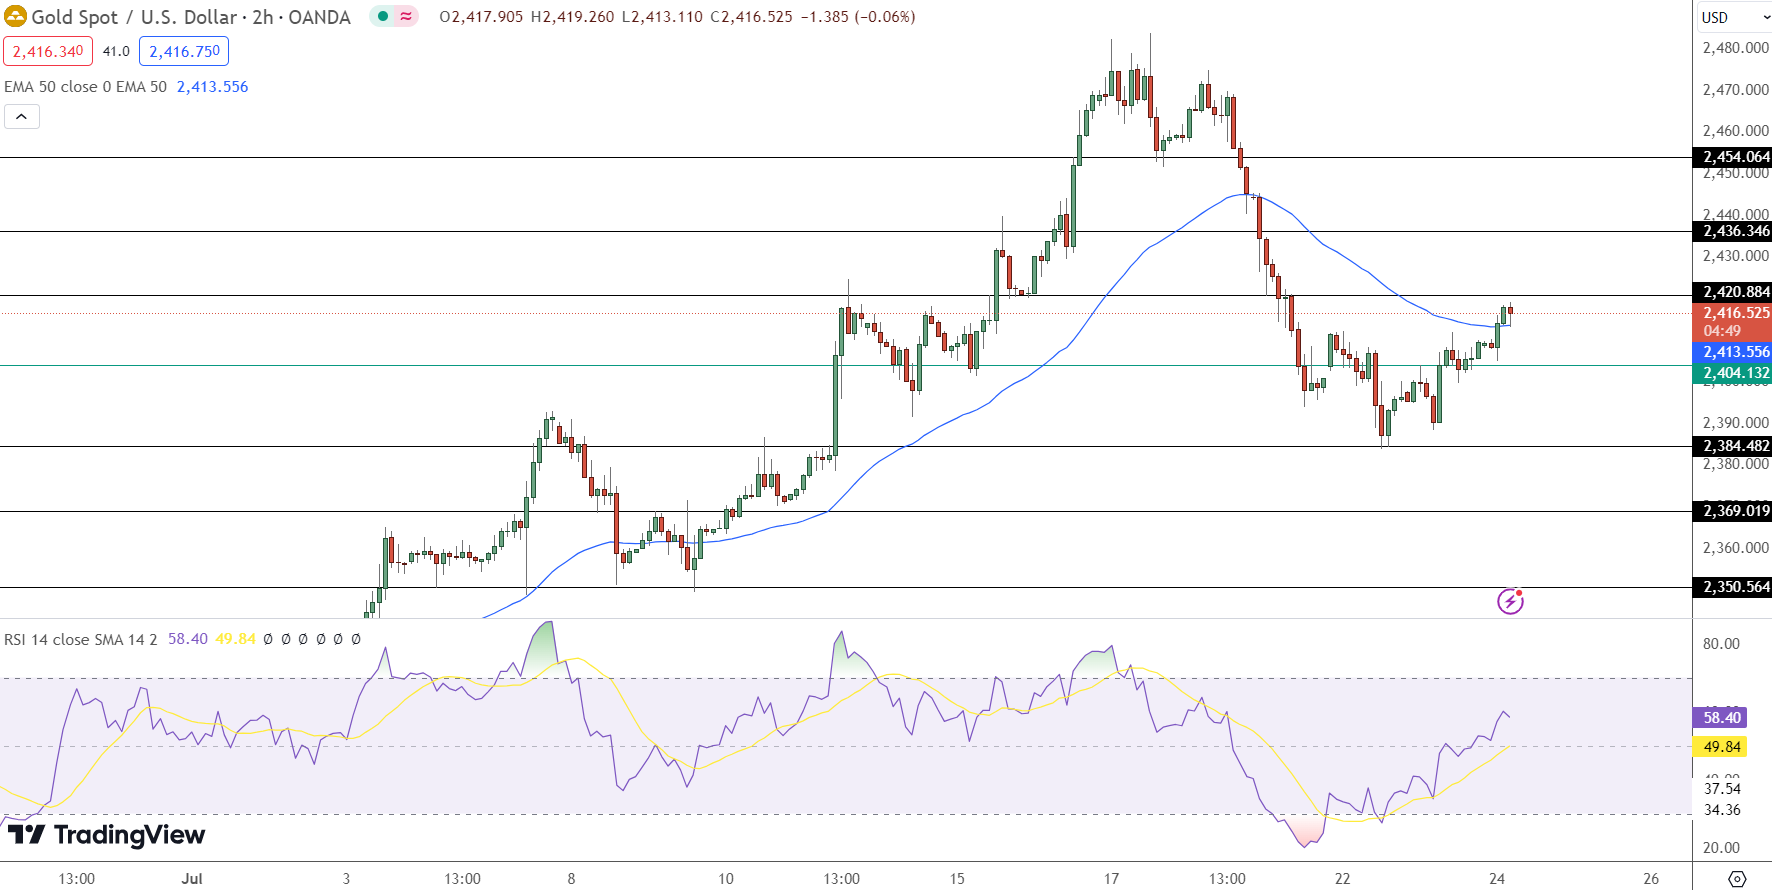
Gold’s Technical Perspective
Conversely, support levels at $2,404.62, $2,384.25, and $2,370.54 will be crucial in buffering any potential declines.
The 50-day and 200-day EMAs are at $2,413.06 and $2,375.75 respectively, suggesting a bullish outlook as long as prices maintain above the pivotal $2,415 threshold.
However, a dip below this critical point could lead to accelerated sell-offs.


Add 3442

Related Posts
Add 3440