Volatility in CHF to USD Despite US Housing Showing Signs of Life
The CHF to USD rate continues to display volatility, with a bearish bias for USD/CHF despite positive US data this week.
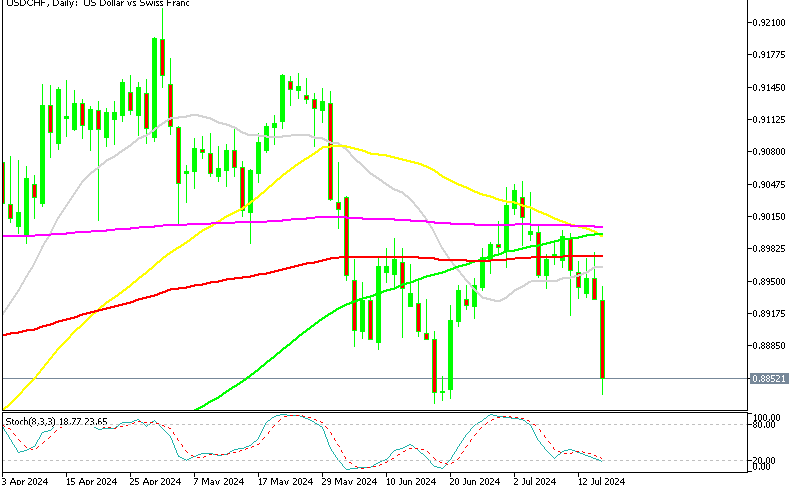
The CHF to USD exchange rate continues to fluctuate. After a strong bullish trend in USD/CHF during the first four months of 2024, the pair has been in a bearish trend since May. The US dollar turned negative in June following a series of disappointing US economic data releases, despite briefly rising above 0.90.
USD/CHF Chat Daily – June’s Support at 0.88 Lows Is Under Attack

Although there has been some positive economic data from the US this week, heightened uncertainty is driving demand for safe havens like gold and the CHF, rather than the US dollar. Consequently, the USD/CHF pair is now trading about two cents below its peak. The earlier rally in USD/CHF was driven by the Swiss Franc’s continued weakening after the Swiss National Bank (SNB) implemented two consecutive rate cuts in recent meetings.
However, over the past two months, the pair has declined as the likelihood of a rate cut by the Federal Reserve has increased due to the weakening US economy. Meanwhile, traders expect the SNB to pause rate cuts, providing additional support for the CHF. After briefly climbing above the 50-day Simple Moving Average (SMA) (yellow) in May, the price has now dropped to lows around 0.80, falling below all moving averages on the daily chart.
Yesterday, the USD/CHF rose following better-than-expected retail sales data. The pair moved up to the 100-day moving average at 0.8978, where the weak bullish momentum stalled and the pair reversed lower, ending the day down. Today’s decline has accelerated, and the pair is down 100 pips on the day, forming a large bearish candlestick. Despite positive US housing data, with Building Permits and New House Starts exceeding expectations, USD/CHF remains bearish.
US Housing Report for June

- June Housing Starts: 1.353 million vs. 1.300 million expected
- May Housing Starts: Revised from 1.277 million to 1.314 million
- Single-Family Housing Starts: -2.2%Multifamily Housing Starts: +19.6%
- June Building Permits: 1.446 million vs. 1.40 million expected
- May Building Permits: 1.395 million (prior)
Yesterday’s NAHB housing index showed a slightly better picture, so today’s numbers weren’t a big surprise, so long-term yields fell to a near three-month low, perhaps investors were anticipating some better figures. This led to a significant surge in homebuilder stocks, as the market anticipates a potential bottom in the housing cycle soon.
USD/CHF Live Chart
- Check out our free forex signals
- Follow the top economic events on FX Leaders economic calendar
- Trade better, discover more Forex Trading Strategies
- Open a FREE Trading Account
Related Articles


Comments
Sidebar rates
Related Posts
