Market Analysis: S&P 500, Dow Jones, and Nasdaq Bullish Trends Signal Potential Gains
Recent market analysis underscores potential for further upside movement, tempered by indicators cautioning about potential downside risks. This analysis examines the S&P 500, Dow Jones Industrial Average, and Nasdaq Composite, all of which have recently reached new all-time highs.
S&P 500 (SPX) Continues Its Upward Movement Despite Bearish Divergence in the Daily Chart
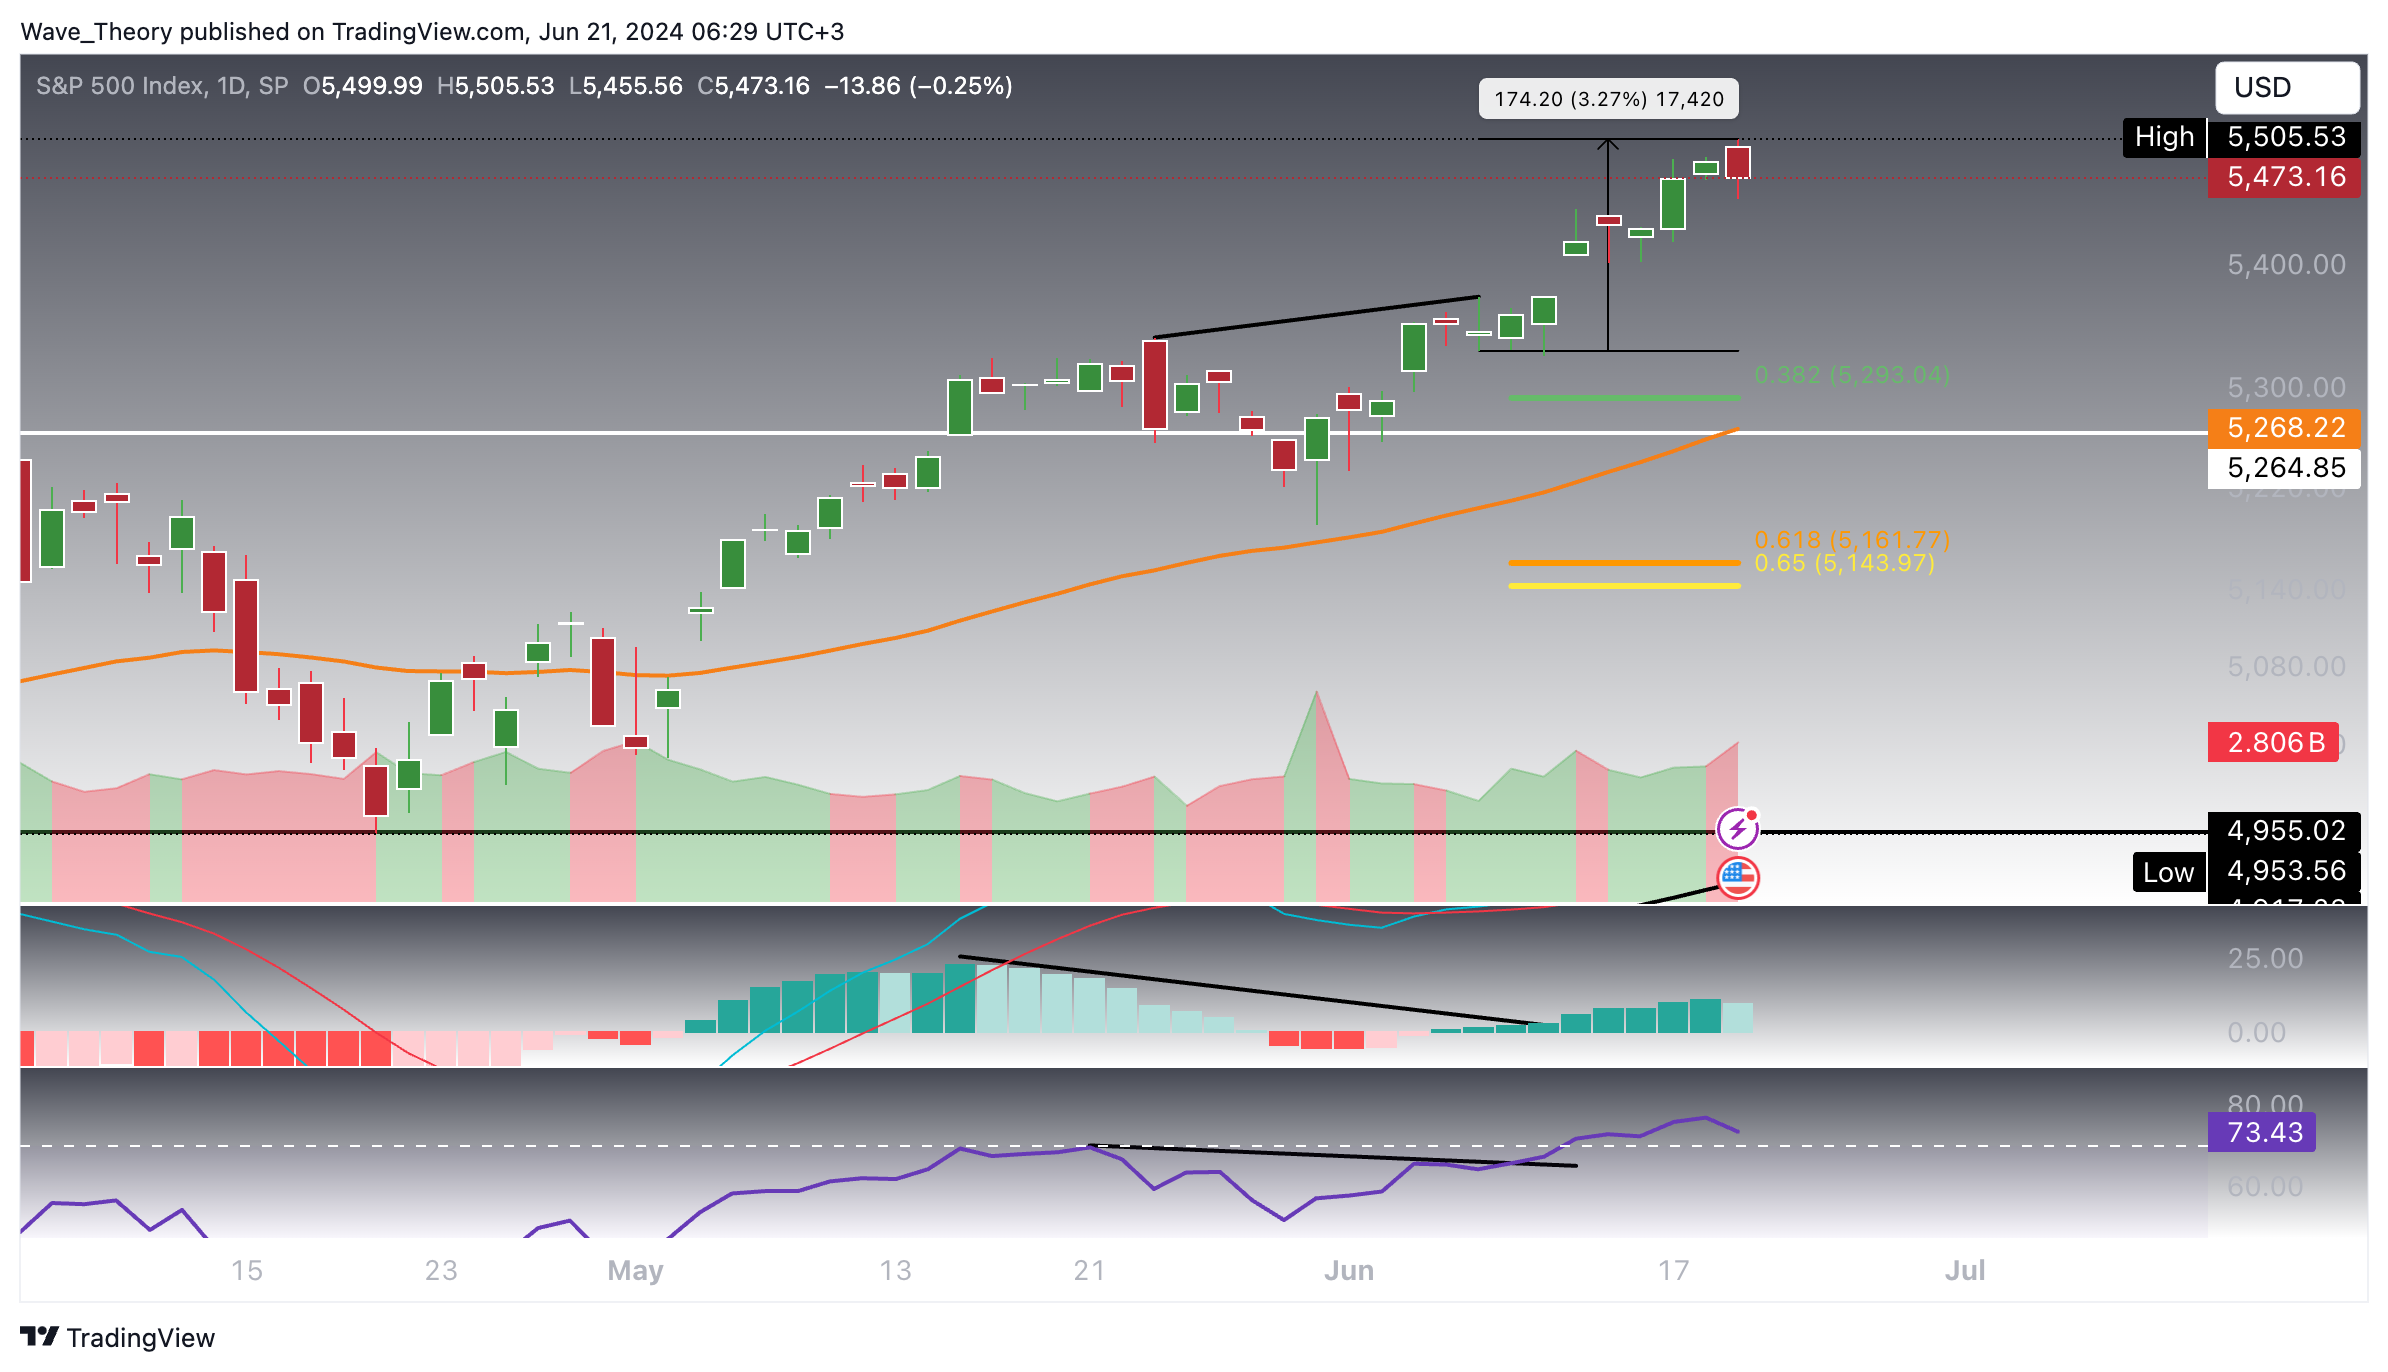
The SPX is in an upward trend, and both the histogram of the MACD and the RSI have shown a bearish divergence on the daily chart. Despite this, the price continued its uptrend, soaring by roughly 3.3%. Today, however, the SPX seems to initiate a correction movement, with the histogram of the MACD beginning to tick bearishly lower.
Should the SPX initiate a correction, it finds its next significant support at the 0.382 Fibonacci level at 5,293, and at the 50-day EMA at 5,268. If these support levels fail, the SPX’s next major Fibonacci support is at the golden ratio at 5,150.
Dow Jones Industrial Average (DJI) Could Potentially Face Rejection At The Golden Ratio Level
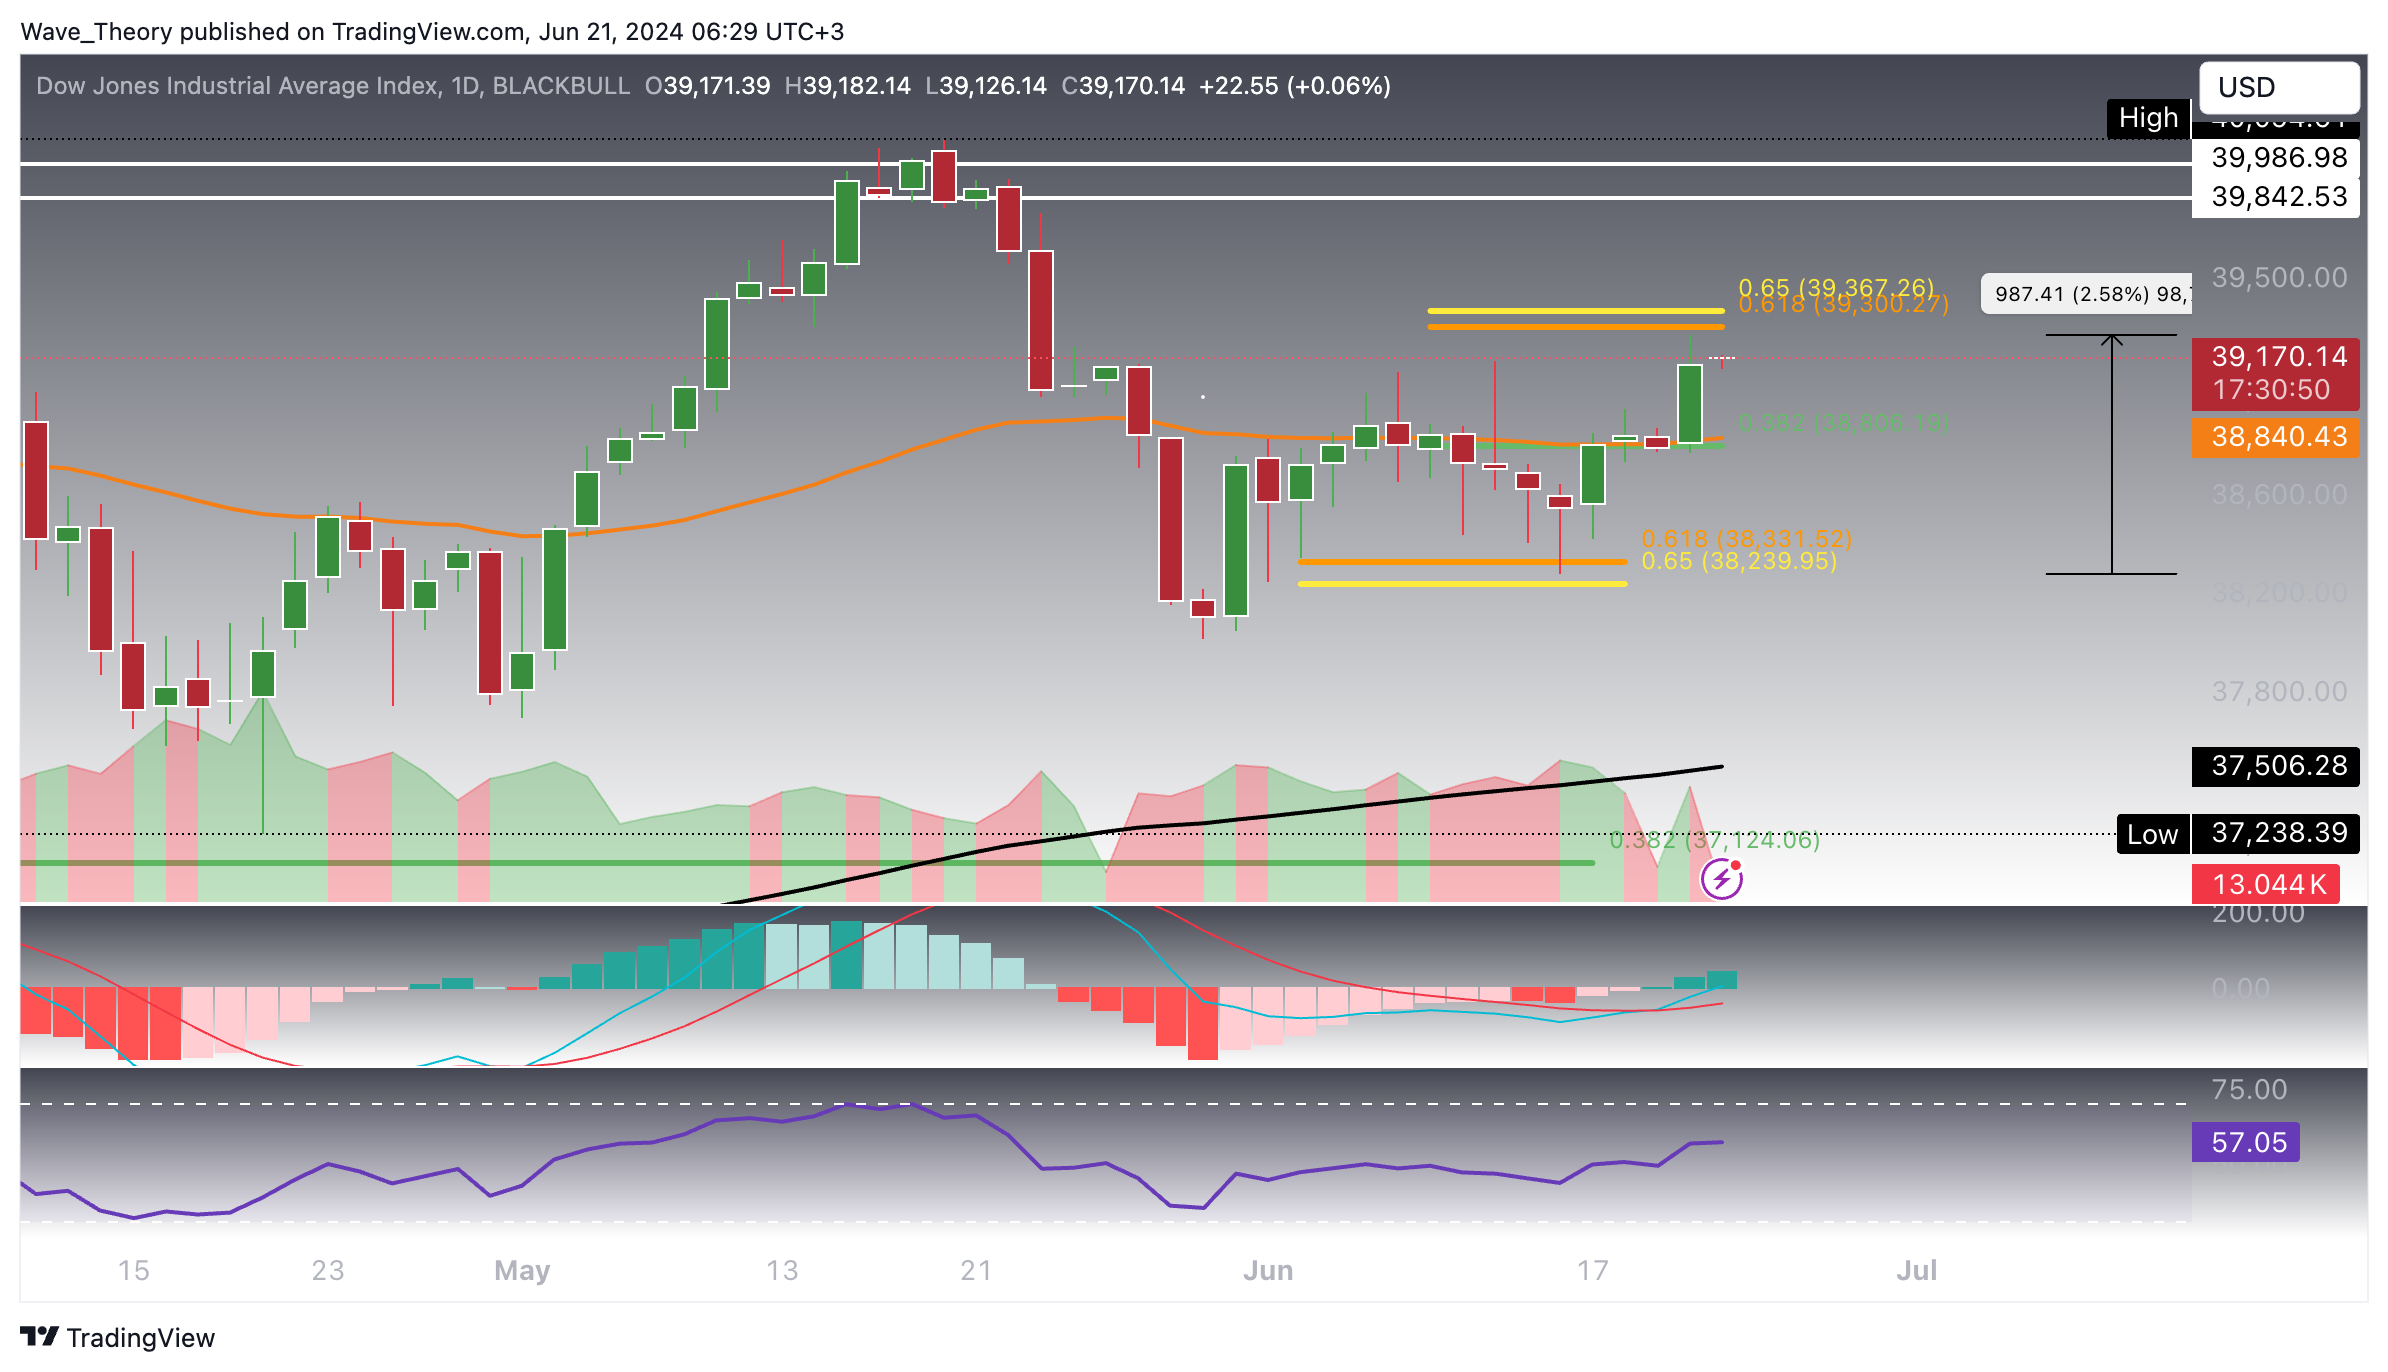
The DJI (US30) bounced off the golden ratio support at 38,300 and broke the 50-day EMA resistance at 38,840, surging by roughly 2.6%. The DJI could now surge to the golden ratio level at 39,350, where it could potentially face rejection.
If it breaks the resistance, it could target its previous high at roughly 40,000. Moreover, the EMAs confirm the trend in the short- to medium term. The histogram of the MACD shows a bullish trend, and the MACD lines are crossed bullishly, while the RSI moves in neutral regions.
Nasdaq Composite in a Correction Trajectory
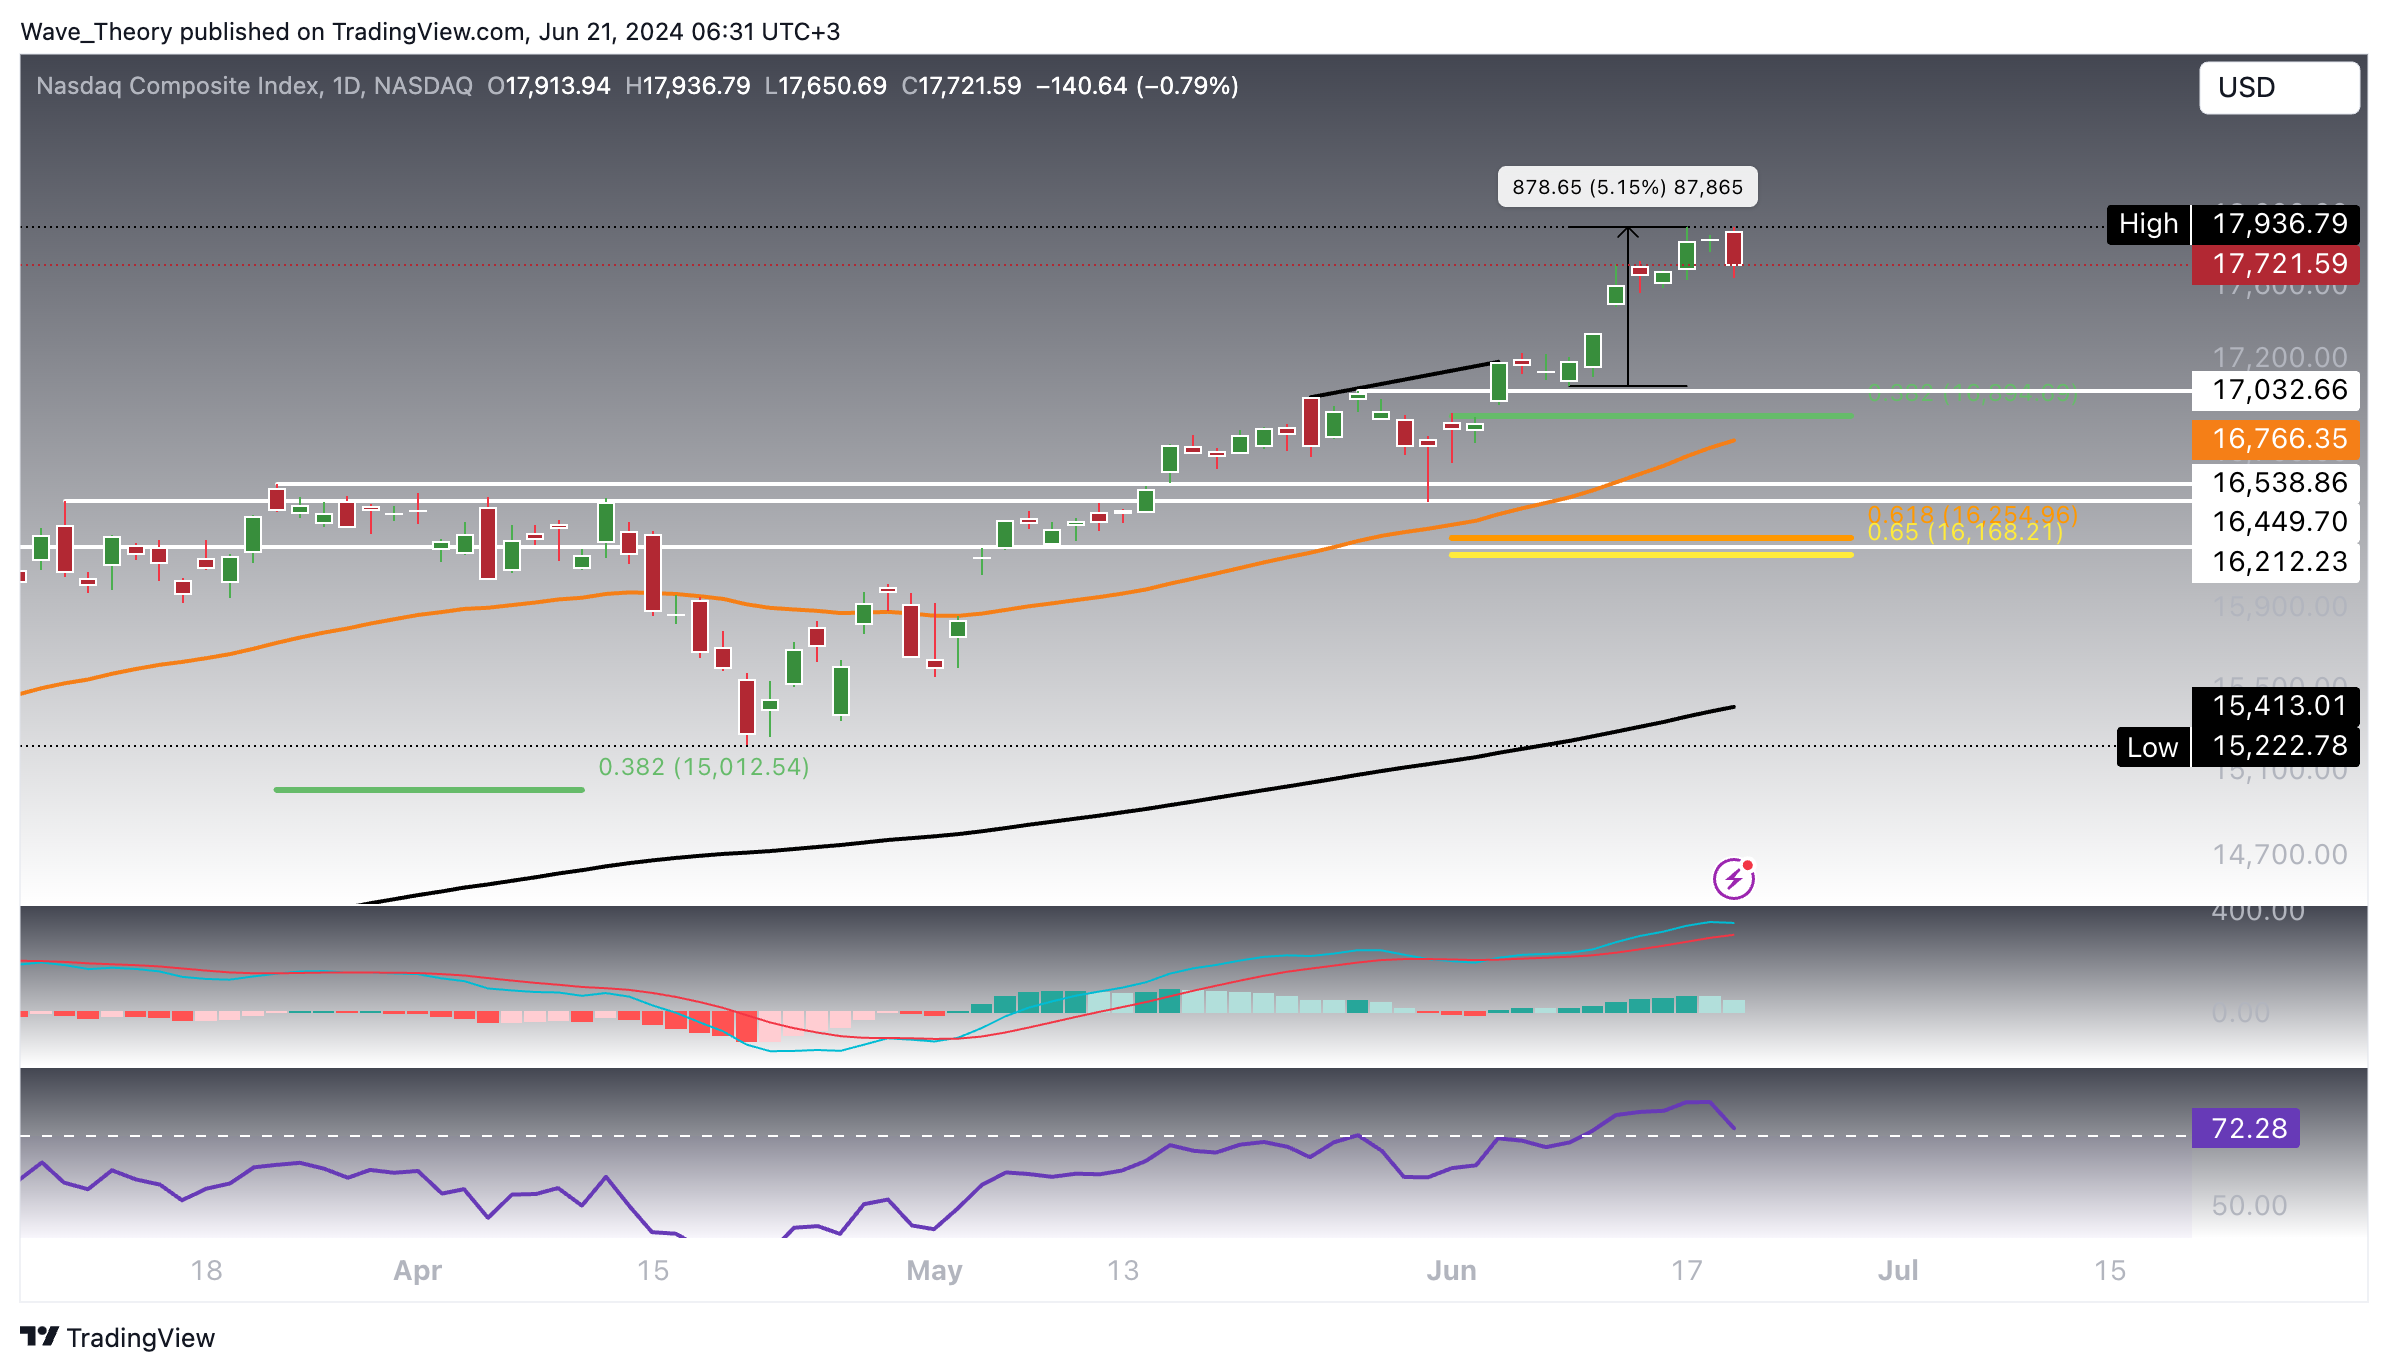
The Nasdaq Composite (IXIC) continues its upward trend and surged by 5.15%, despite the RSI previously forming a bearish divergence. Now, however, IXIC could potentially undergo a correction move, retracing down to the next significant support at 17,033. Moreover, it finds major Fibonacci supports at 10,094 and 16,200.
The indicators are giving rather bearish signs, as the RSI is in overbought regions and the histogram ticks bearishly lower since yesterday. The MACD lines are still crossed bullishly, and the EMAs confirm the trend as bullish in the short- to medium term.


Sidebar rates
Related Posts
