S&P 500, DJIA, and NASDAQ: Bullish Momentum with Cautious Indicators

Recent market analysis underscores potential for further upside movement, tempered by indicators cautioning about potential downside risks. This analysis examines the S&P 500, Dow Jones Industrial Average, and Nasdaq Composite, all of which have recently reached new all-time highs.
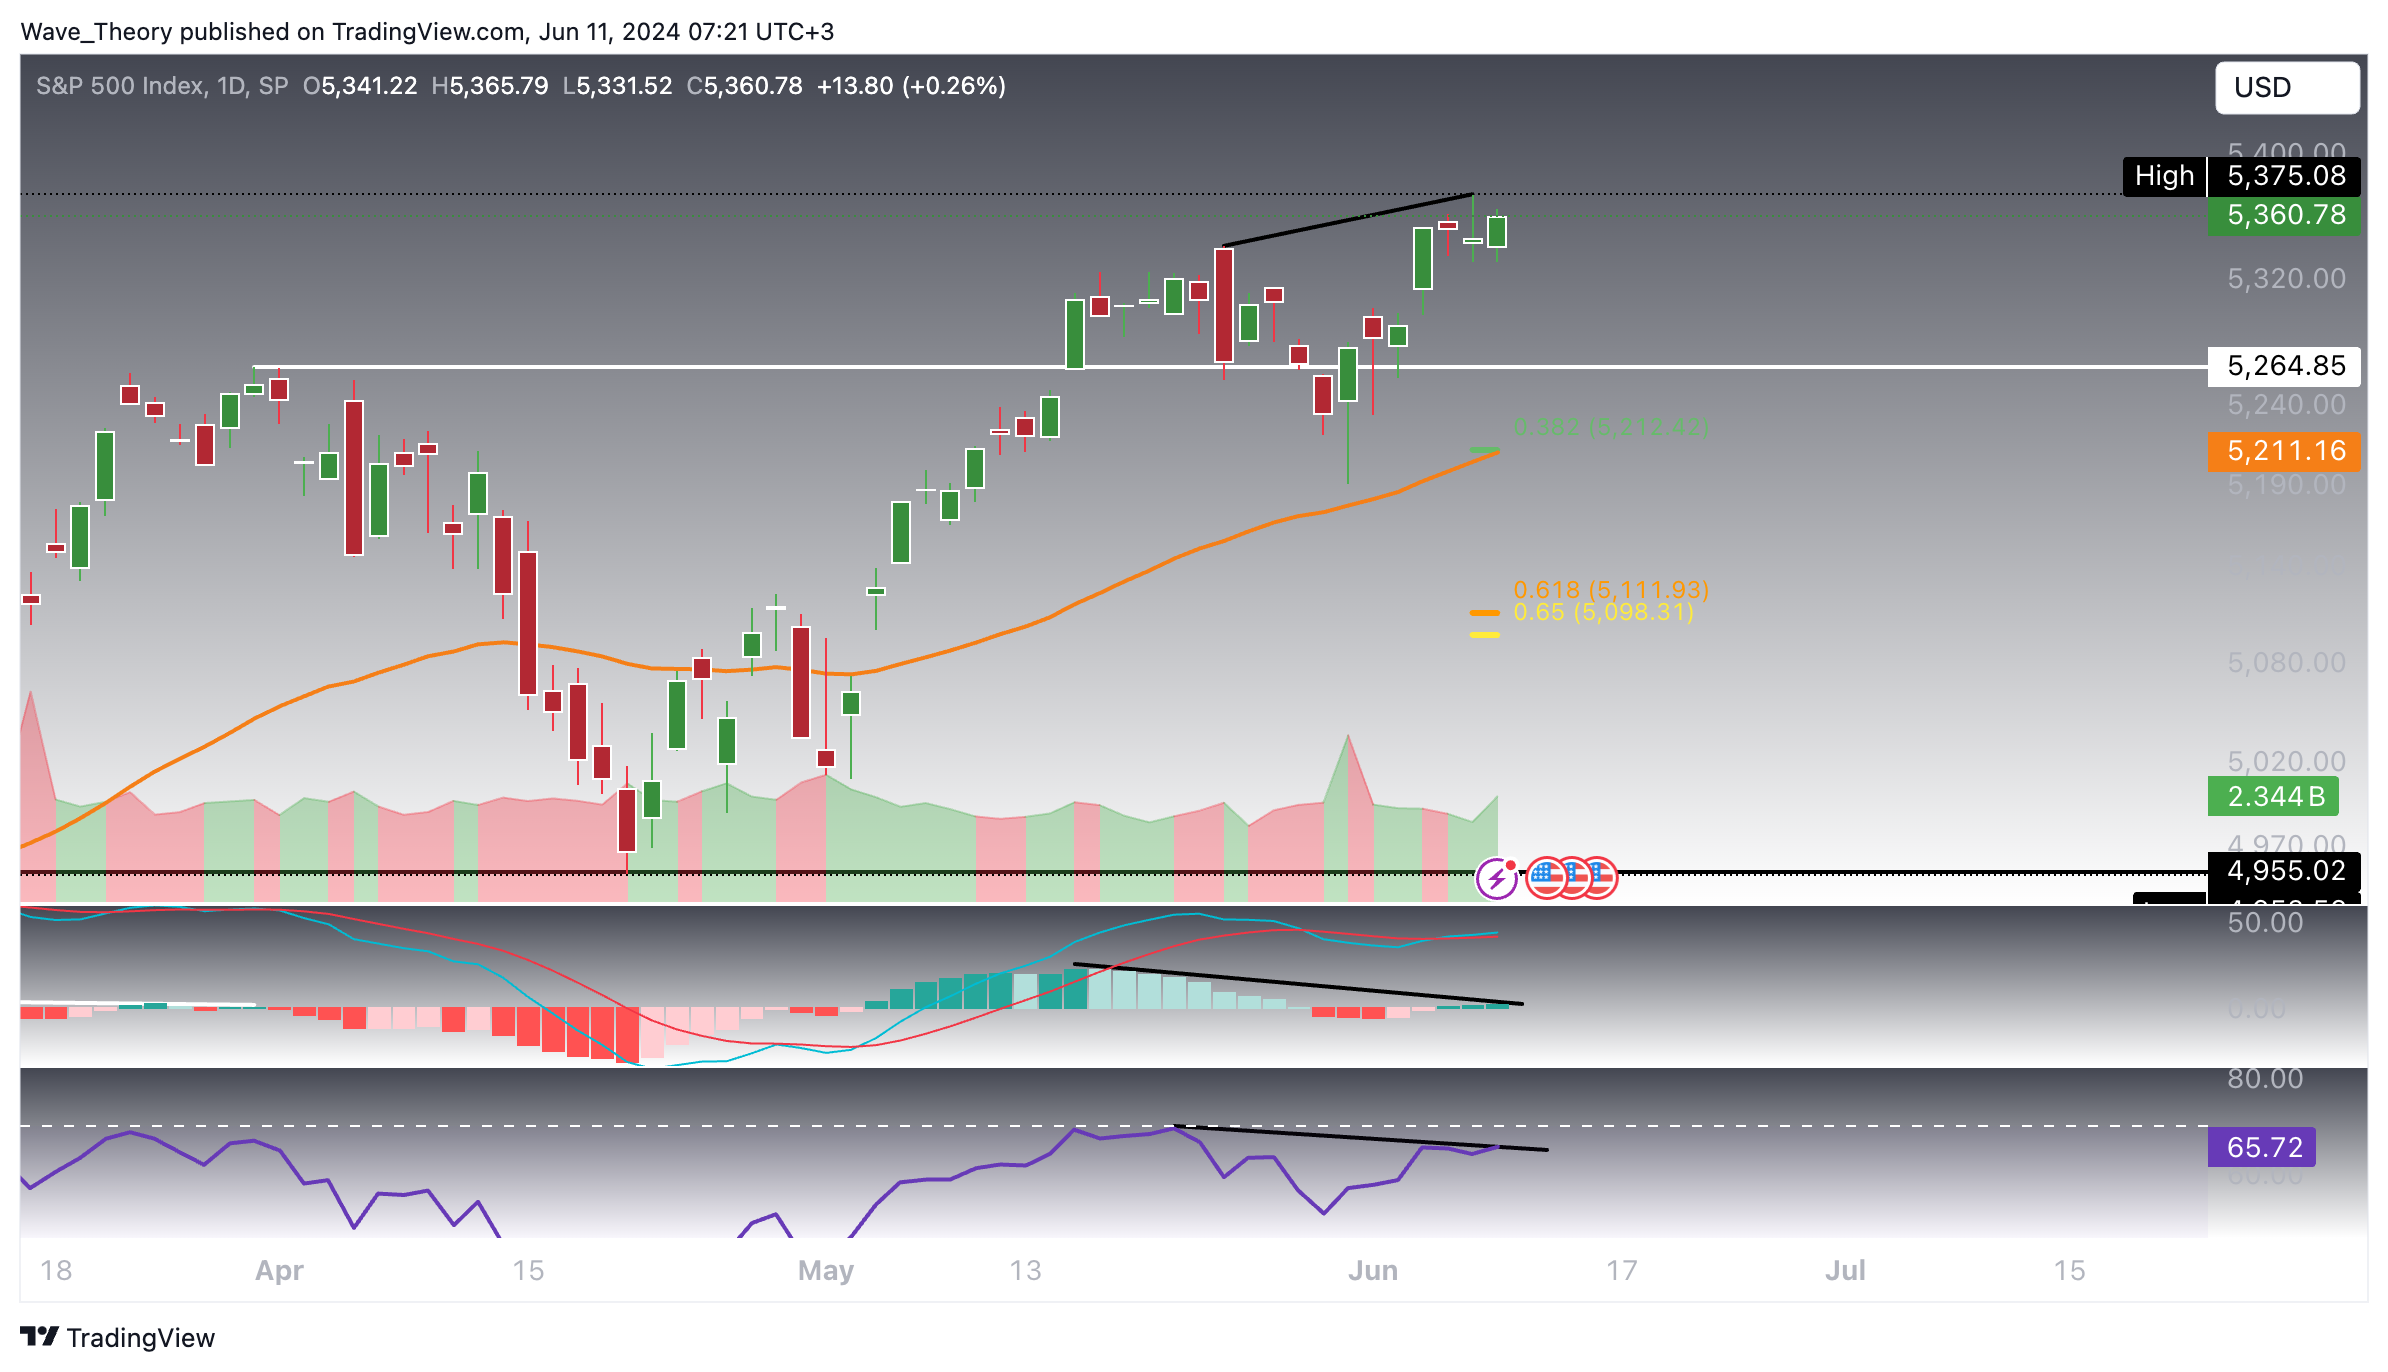
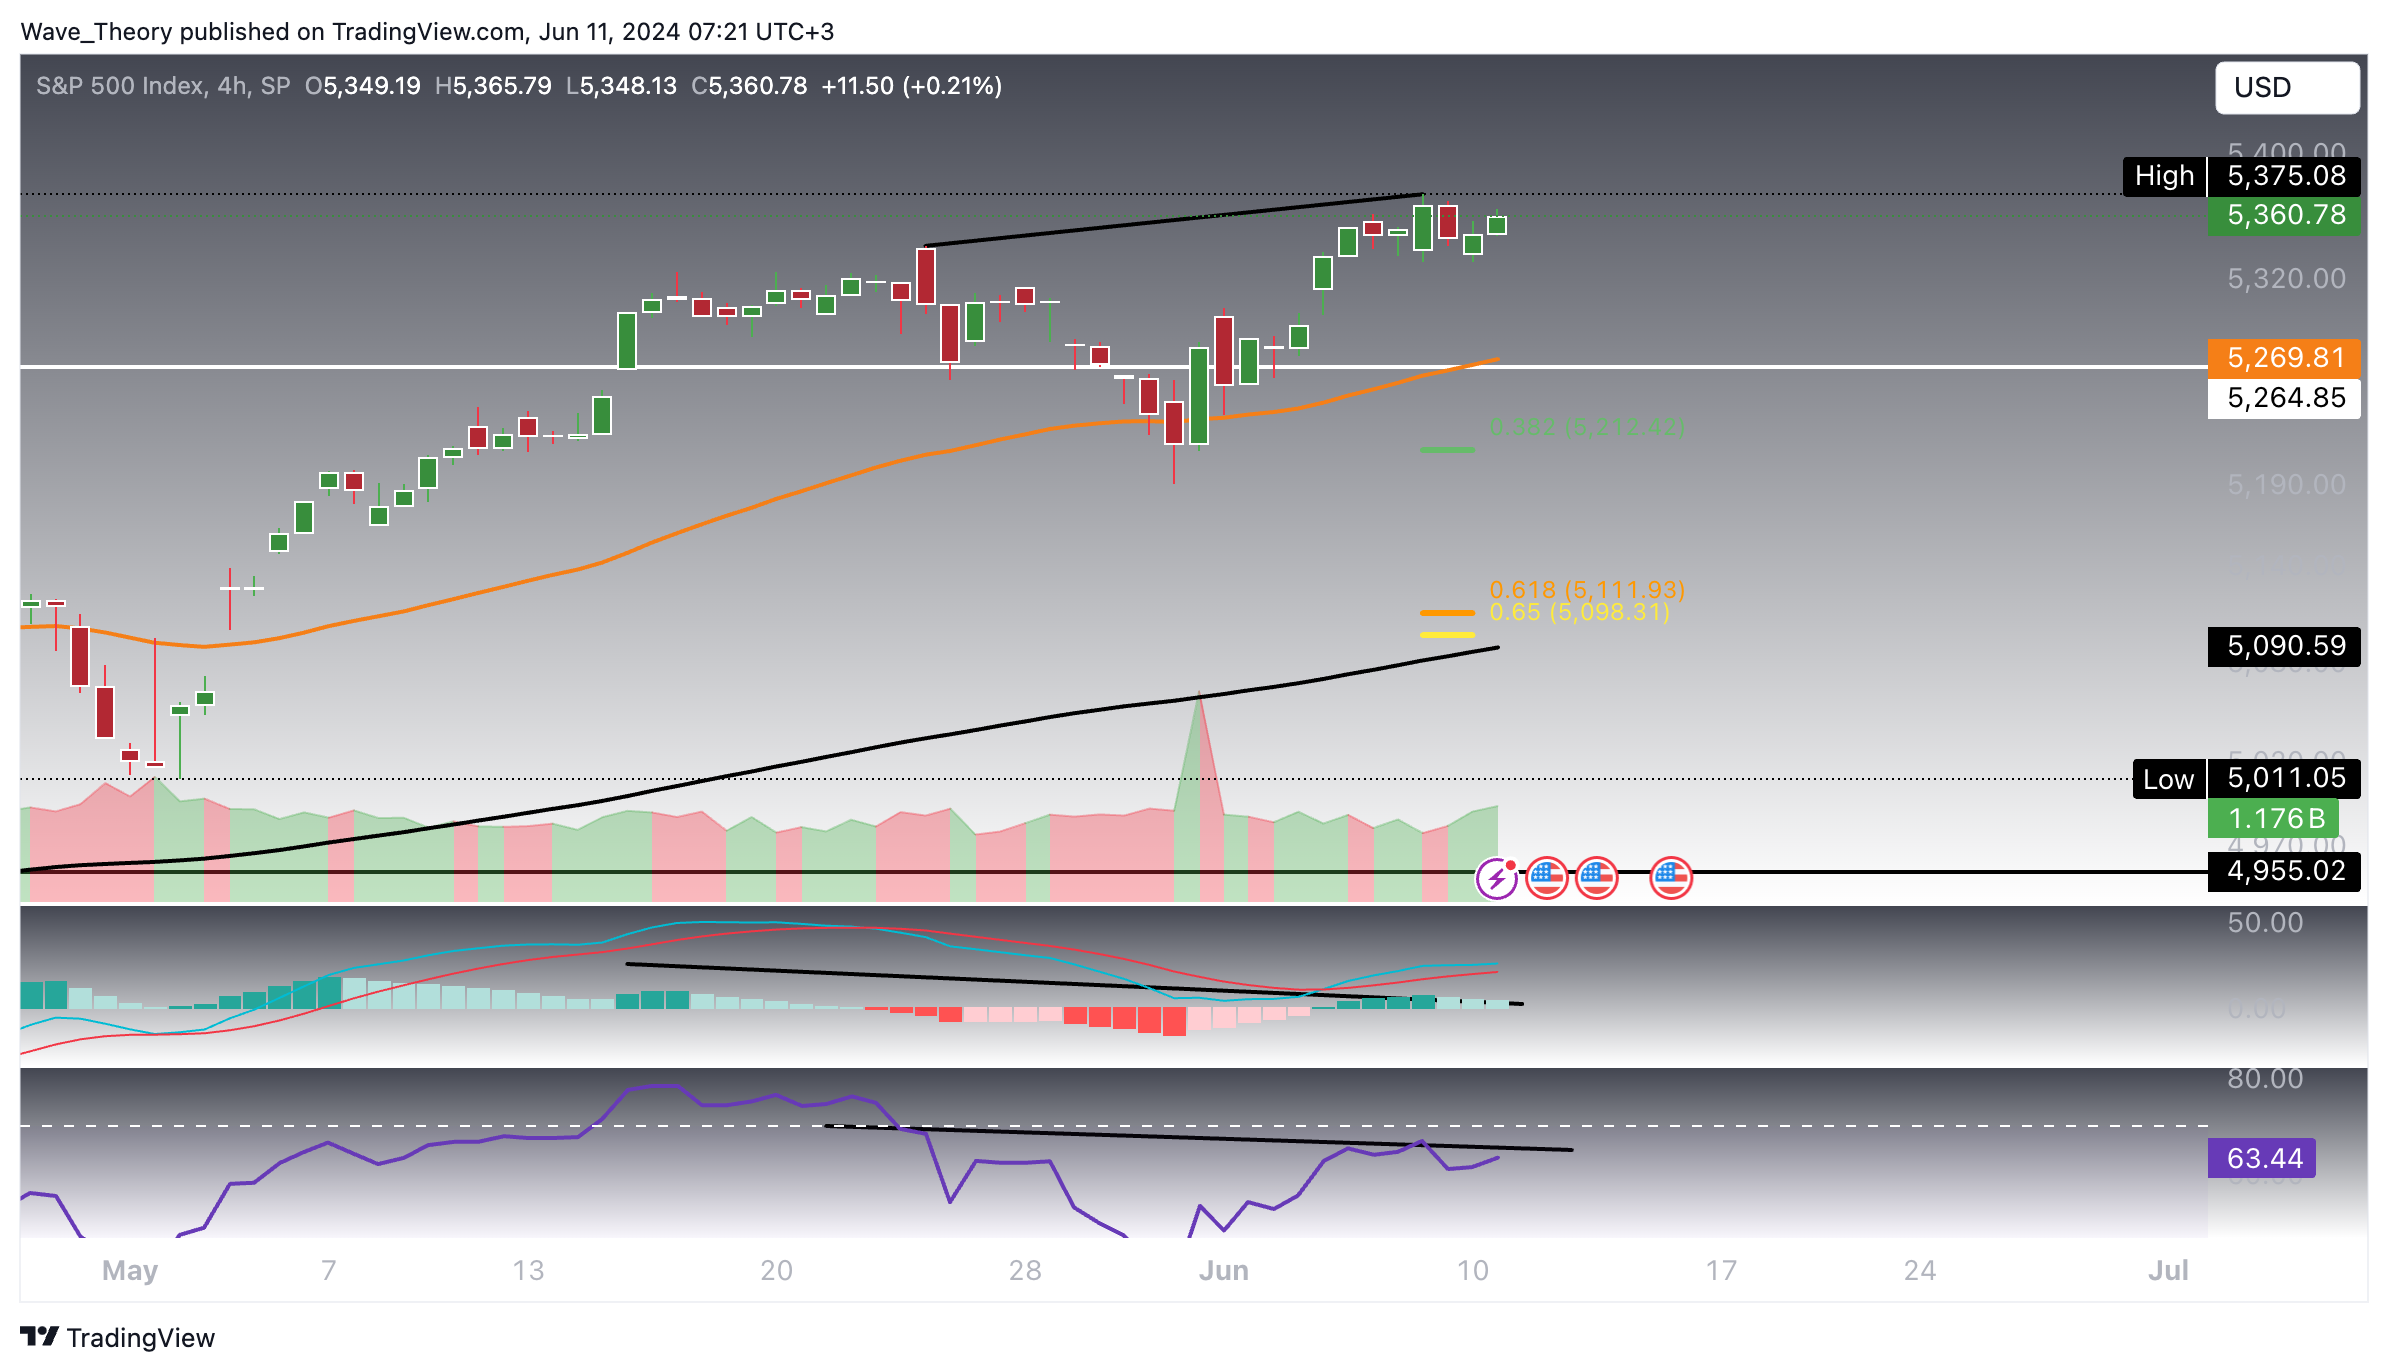
S&P 500 (SPX) Continues Its Upward Movement But Forms a Bearish Divergence in the Daily Chart
The SPX is in an upward trend, but the histogram of the MACD and the RSI both show a bearish divergence on the daily chart. Despite this, the EMAs still show a golden crossover, confirming a bullish trend in the short to medium term. Additionally, the MACD lines remain crossed bullishly.
Should the SPX initiate a correction, it finds its next significant support at the 0.382 Fibonacci level at 5,212, where the 50-day EMA also acts as support. If these support levels fail, the SPX’s next major Fibonacci support is at the golden ratio at 5,100.
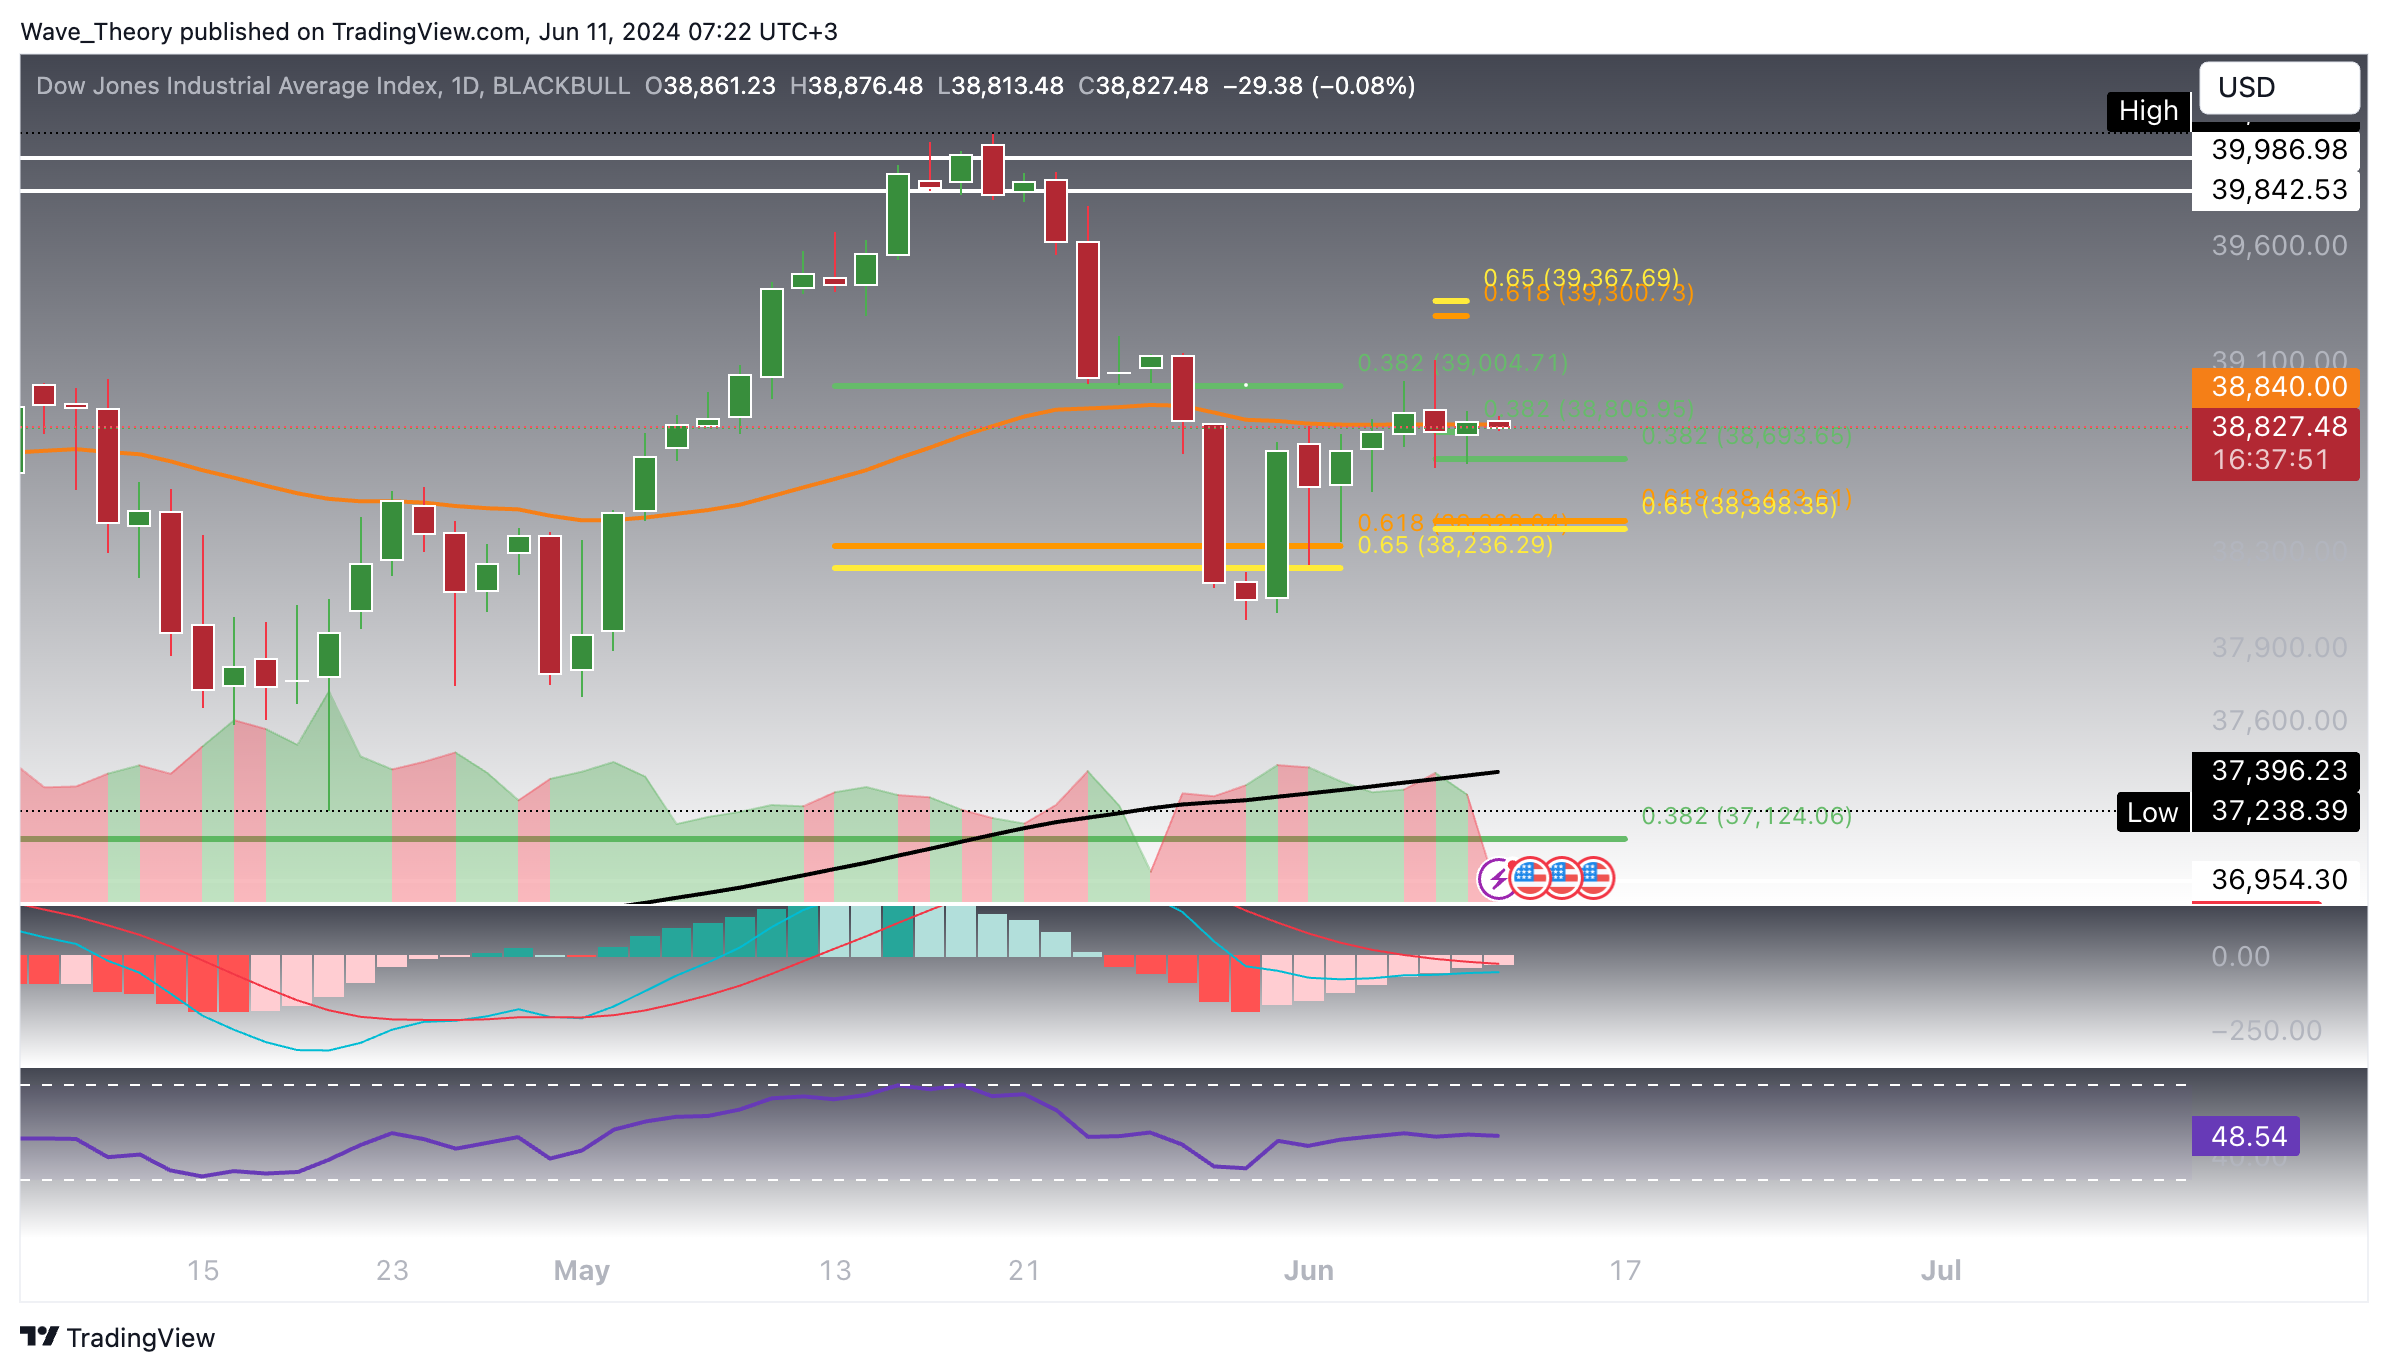
Dow Jones Industrial Average (DJI) Moves Between Fib Levels
The DJI (US30) faced rejection at the 0.382 Fibonacci resistance at 39,004 and retraced to the 0.382 Fibonacci support at 38,693, where it found short-term support. If this support holds, the DJI could attempt another break of the 39,004 resistance. A successful break could see the DJI surge to the golden ratio at 39,600. Breaking the golden ratio at 39,600 would indicate the completion of the correction, potentially leading to a new all-time high at 40,077.
The MACD histogram shows a bullish trend, with the MACD lines potentially crossing bullishly. Meanwhile, the RSI is neutral, and the golden crossover of the EMAs confirms a bullish trend in the short to medium term.
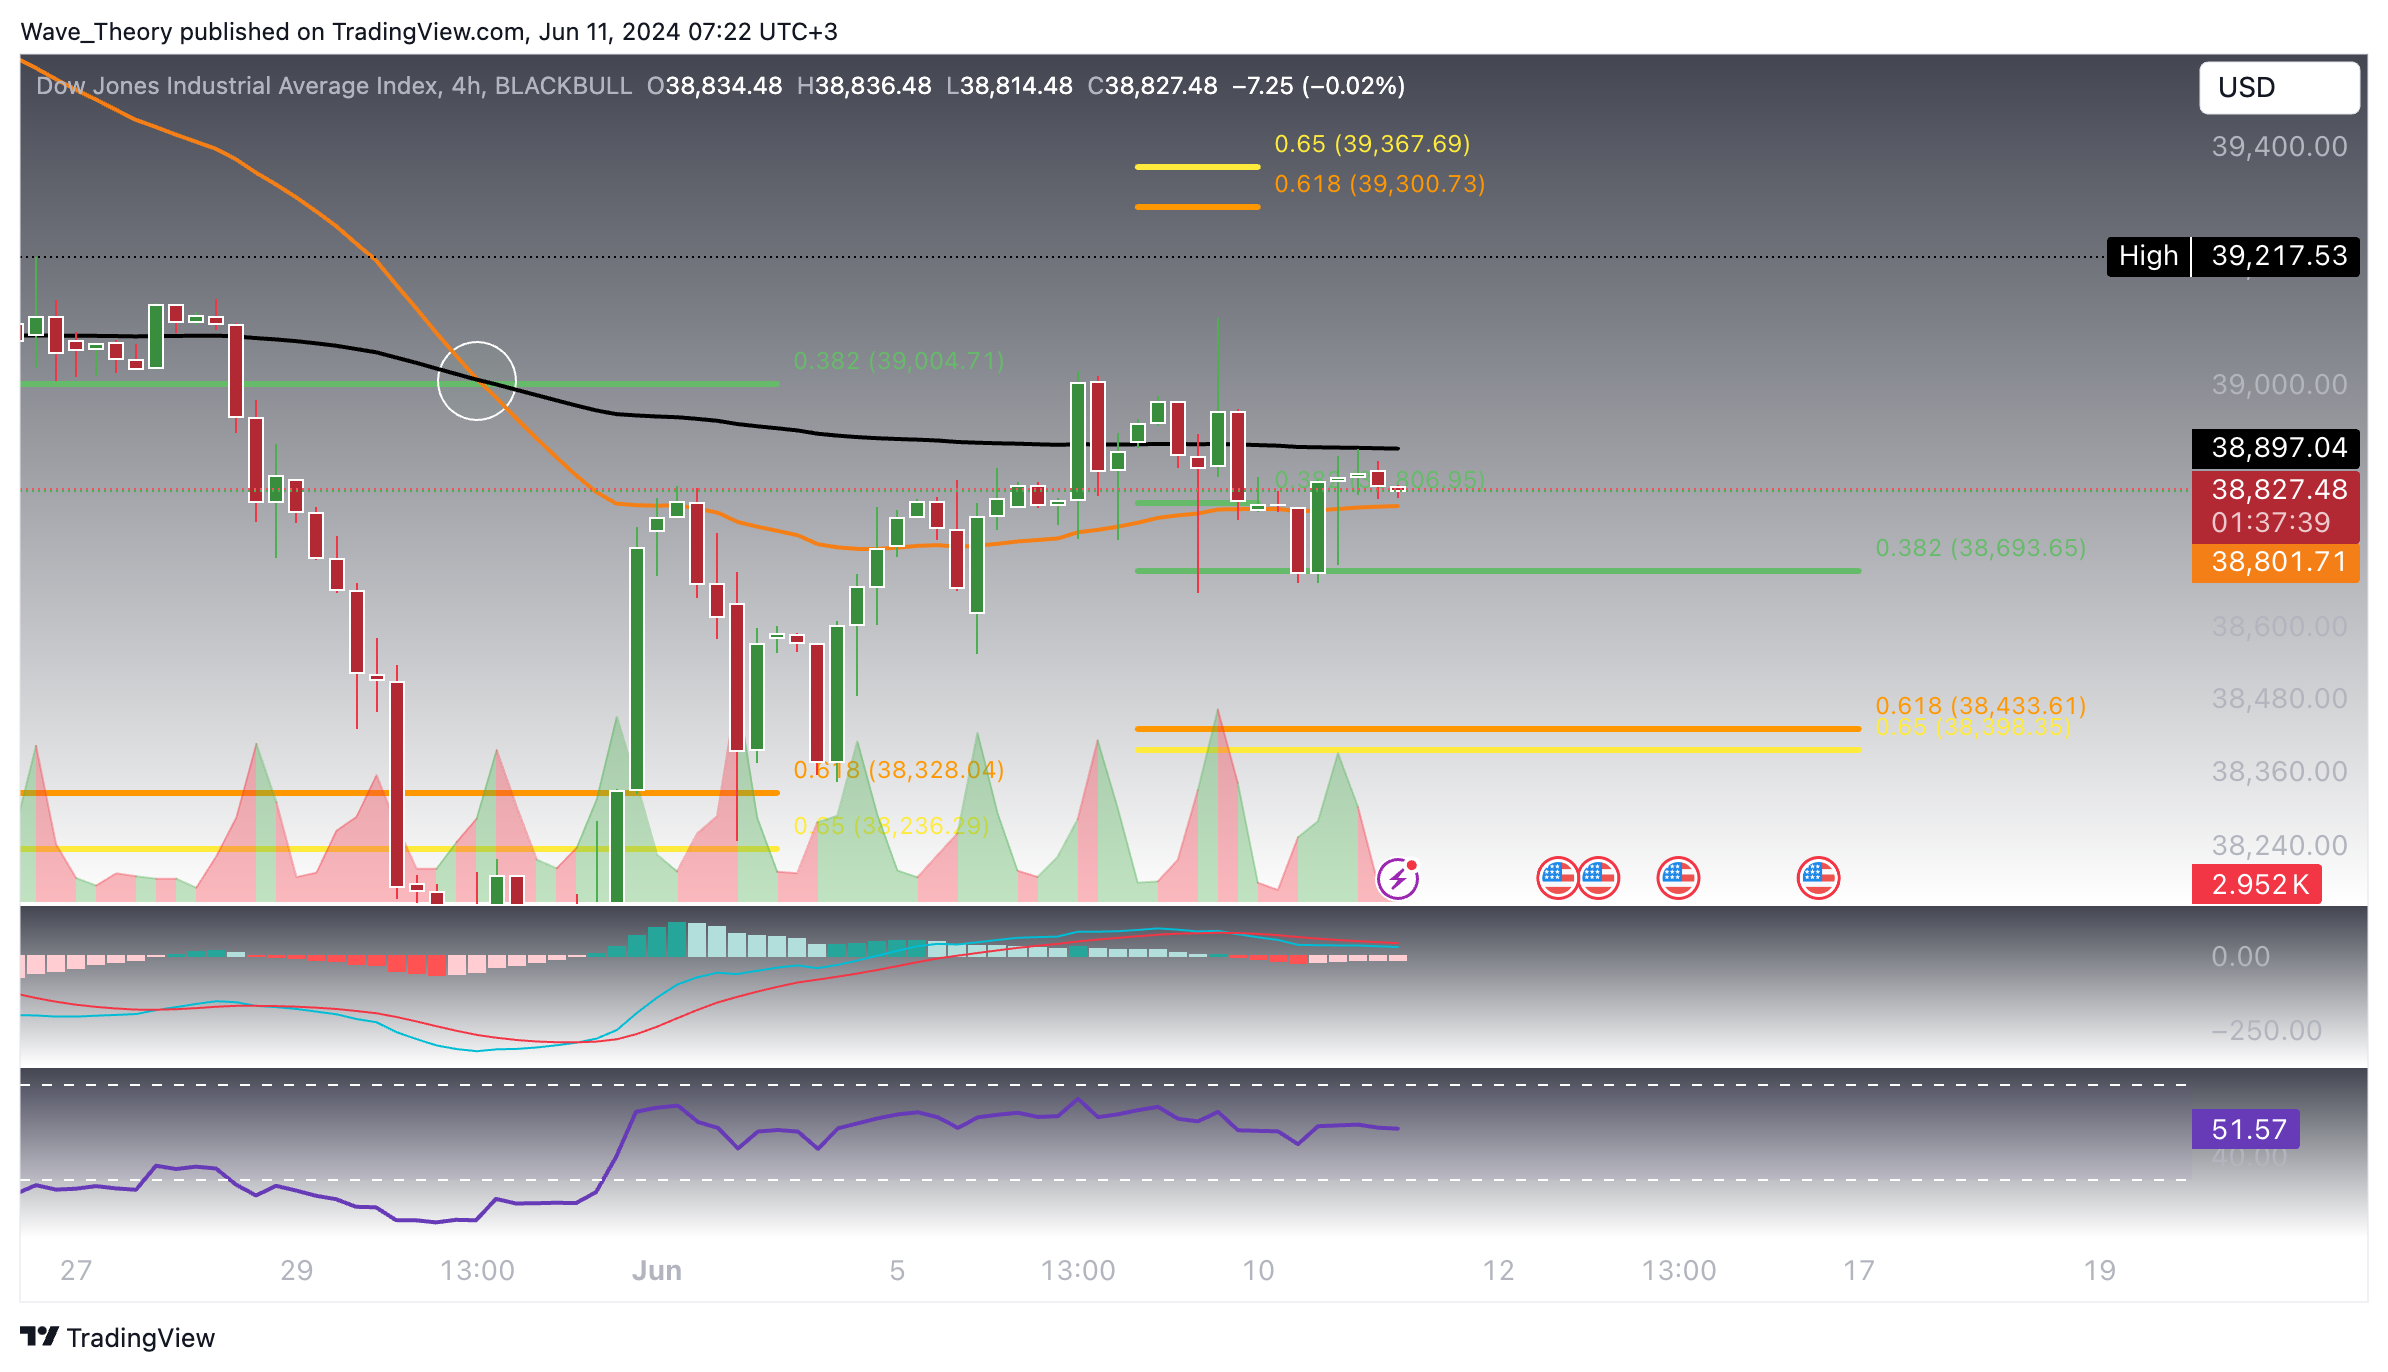
In the 4-hour chart, the emergence of a death cross denotes a bearish trend, despite the bullish uptick in the MACD histogram. The MACD lines remain crossed bearishly, and the RSI is neutral. Should the DJI break the 0.382 Fibonacci support at 38,694 bearishly, it could drop to the golden ratio support at 38,400.
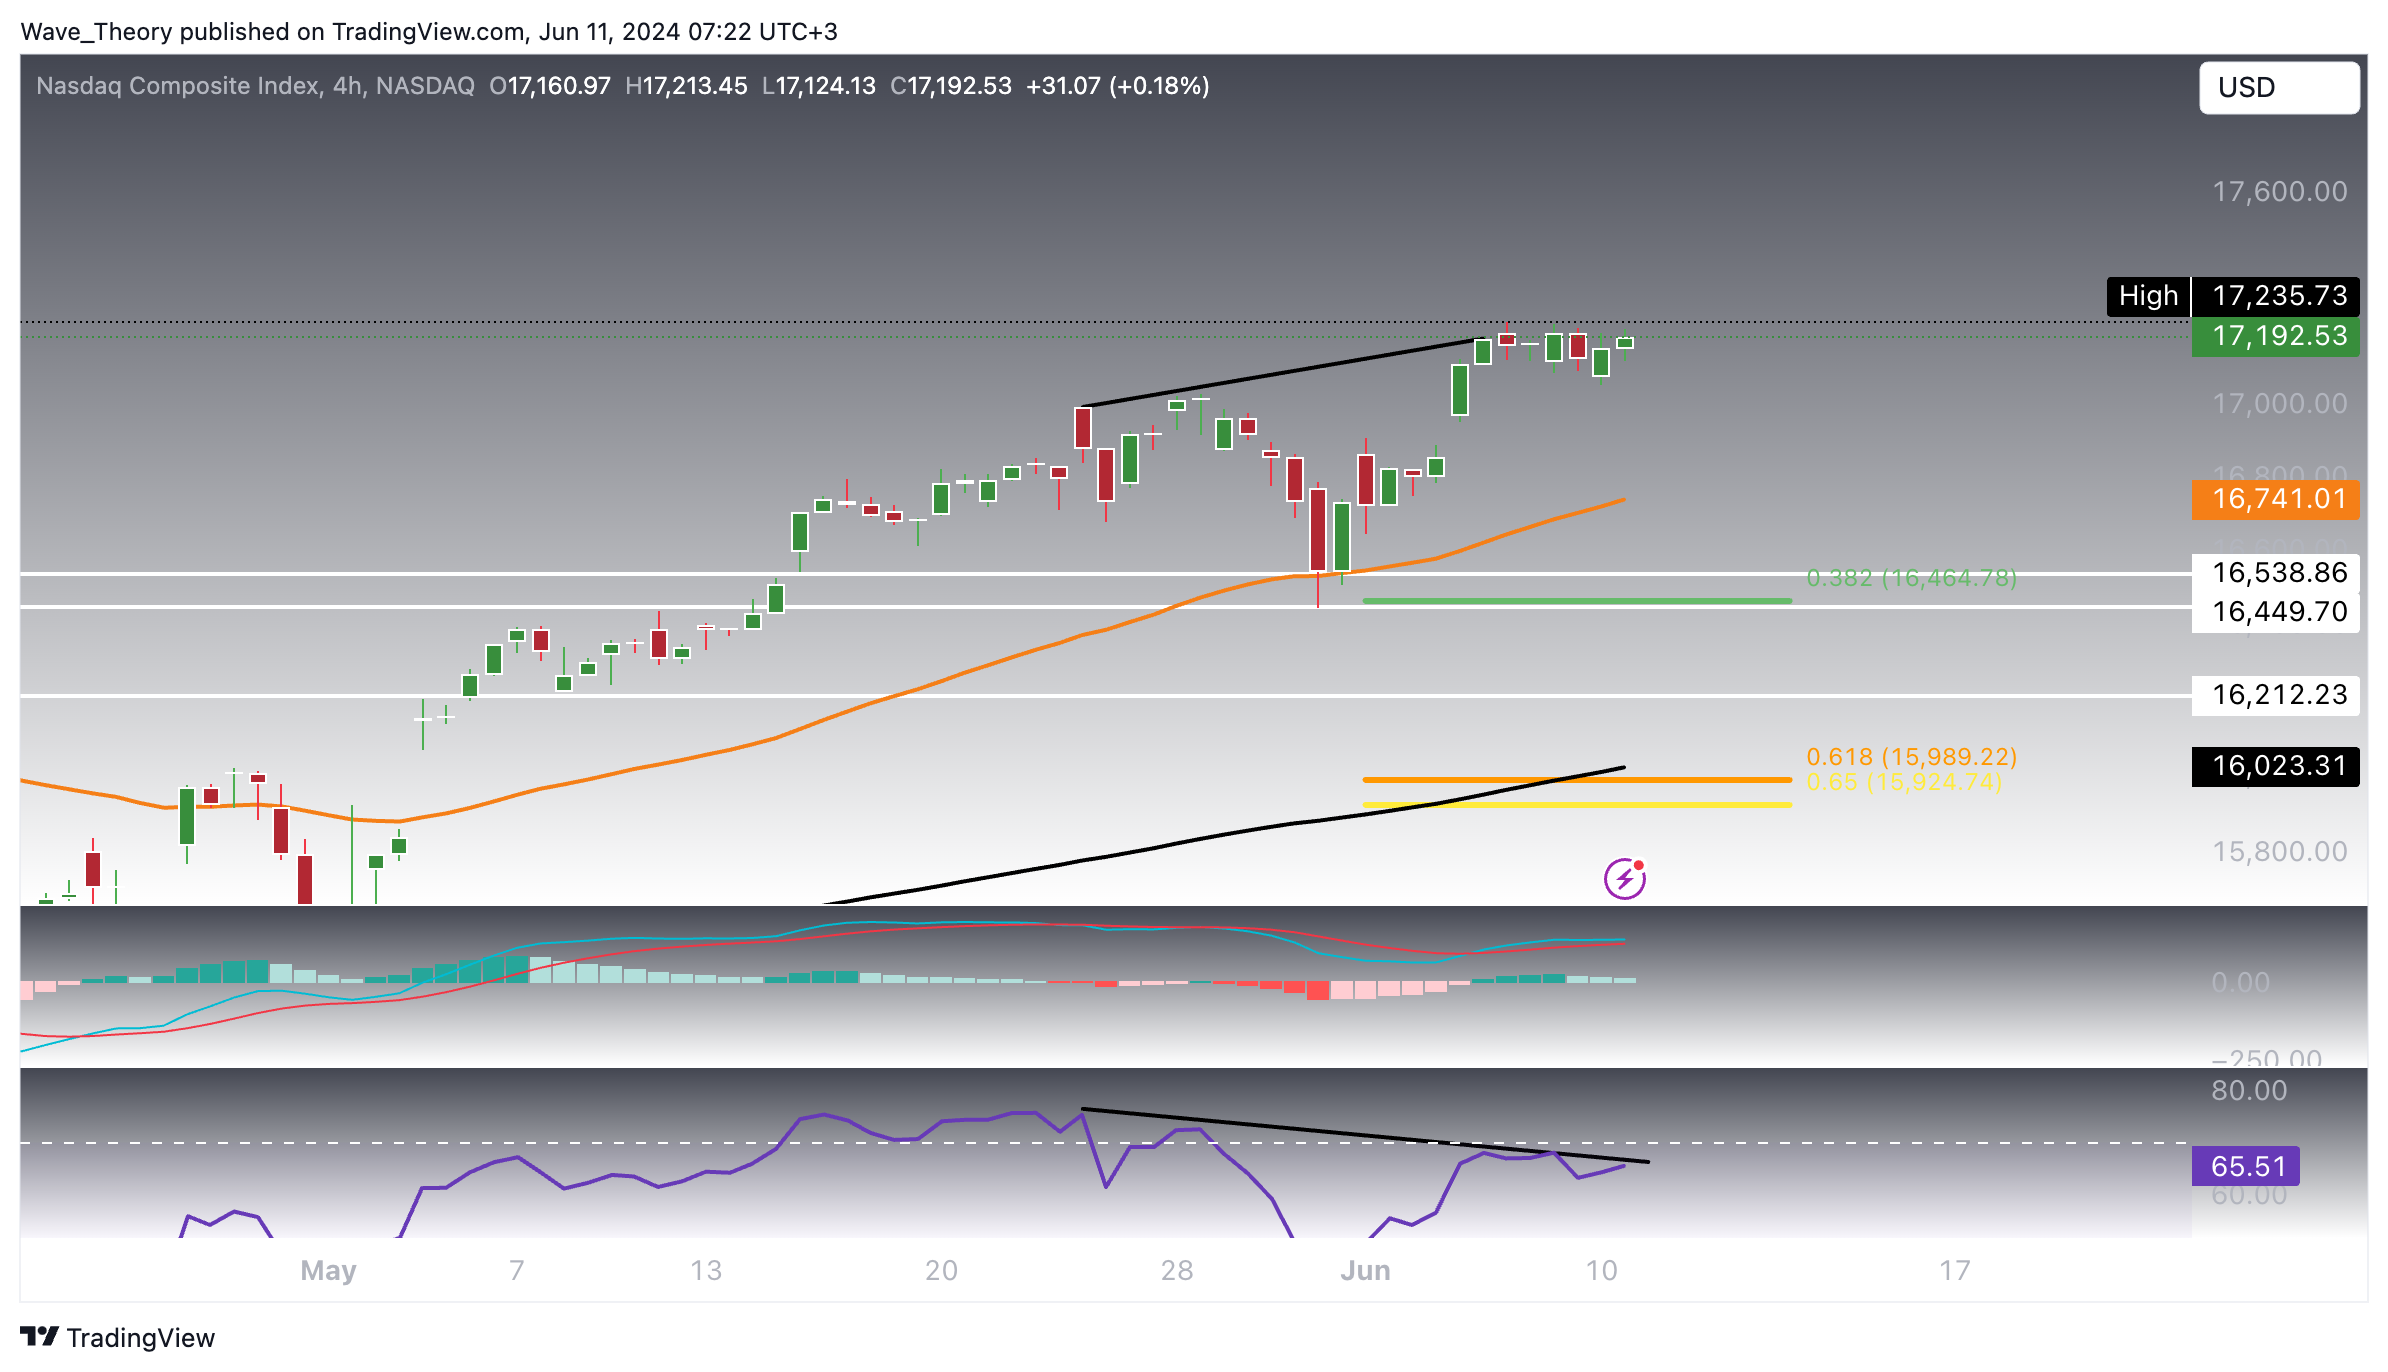
Nasdaq Composite in a Correction Trajectory
The Nasdaq Composite (IXIC) continues its upward trend, but the RSI and MACD histogram show a bearish divergence, indicating a potential correction. Should the Nasdaq undergo a correction, it finds its next significant support between 16,450 and 16,540, where the 0.382 Fibonacci level and 50-day EMA provide additional support.
Despite the bearish divergence, the MACD lines remain crossed bullishly, and the MACD histogram is ticking higher.

NasdaqIn the 4-hour chart, the MACD histogram is ticking bearishly lower, and the RSI shows a bearish divergence. However, the MACD lines are still crossed bullishly, and the golden crossover of the EMAs confirms a bullish trend in the short term.
- Check out our free forex signals
- Follow the top economic events on FX Leaders economic calendar
- Trade better, discover more Forex Trading Strategies
- Open a FREE Trading Account
Related Articles


Comments
Sidebar rates
Related Posts
