NASDAQ 100 Daily Technical Outlook: Key Levels to Watch as Index Trades at $19,020
The NASDAQ 100 Index currently stands at $19,021.19, reflecting a slight decline of 0.08% in the four-hour chart. What's next?
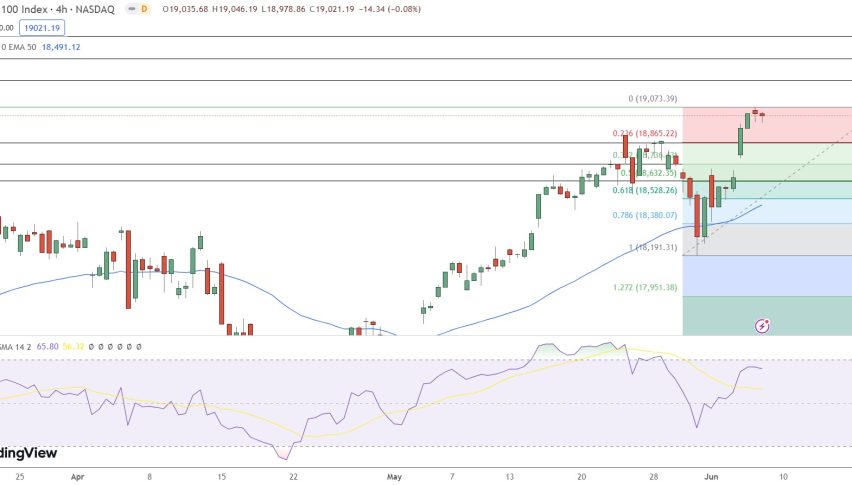
The NASDAQ 100 Index currently stands at $19,021.19, reflecting a slight decline of 0.08% in the four-hour chart. The pivot point for today’s trading session is positioned at $19,074.74, a crucial level that could dictate the market’s direction.
Immediate resistance levels are identified at $19,231.79, followed by $19,359.40, and a higher resistance at $19,493.54. On the downside, the index finds immediate support at $18,861.55, with further support levels at $18,736.53 and $18,635.82.
NASDAQ 100 In Overbought Zone
The Relative Strength Index (RSI) stands at 65, which is approaching overbought territory, indicating potential for a pullback. The 50-day Exponential Moving Average (EMA) is positioned at $18,491.12, suggesting a continued bullish trend as long as the price remains above this level.
The pivot point at $19,074.74 is critical for traders to watch. If the NASDAQ 100 breaks above this level, it could target the first resistance at $19,231.79, with the potential to advance further to $19,359.40 and $19,493.54. Conversely, if the index fails to hold above the immediate support at $18,861.55, it could see a decline towards $18,736.53 and further down to $18,635.82.
The RSI at 65.80 indicates that the index is nearing overbought conditions, which could signal a potential pullback if the buying momentum is not sustained. The 50 EMA at $18,491.12 supports the current bullish outlook, as long as the price remains above this moving average.
Conclusion; NASDAQ 100 to Drop Under $19,075
The NASDAQ 100 Index is consolidating just below the pivot point of $19,074.74. A decisive break above this level could open the path towards the first resistance at $19,231.79. However, failure to maintain above-immediate support at $18,861.55 could push the index lower towards $18,736.53. Traders should monitor the RSI closely for signs of overbought conditions, which could prompt a short-term pullback.
- Check out our free forex signals
- Follow the top economic events on FX Leaders economic calendar
- Trade better, discover more Forex Trading Strategies
- Open a FREE Trading Account
Related Articles
Comments
Sidebar rates
Related Posts
